
A baseline is defined as a time-based standard against which performance is measured.
A project baseline is a time-based, progressive plan as opposed to one, single target value.
Projects will often have a single, target value, but it is important to know if the project is in good health at any given intermediate project control point. The baseline establishes the temporary target which, if achieved, represents a project that is or is not on track.
The Project Management Body of Knowledge (PMBOK Guide) specifies the use of project baselines in three categories: Cost, schedule, and scope.
- Cost
- Schedule
- Scope
Project Cost Baseline
Exceeding your project budget is one of the easiest ways to raise the blood pressure of managers and executives. Although some project managers are at more liberty than others to make adjustments to their budget, projects always represent the expectation of a financial expenditure in exchange for a product (or service). By definition, mid-project changes to that budget appear on the surface to be spending more money for the same product.
A budget value is, a described above, a single target value rather than a time-phased baseline.
Conversion to a baseline allows intermediate performance review to assess the vital signs and determine if the project is on track against the initial project plan at some intermediate point to meet its budget goal.
In theory, it’s not a conversion but rather an interpolation – filling in the blanks from project start (zero budget expenditure) to the deadline (full budget expenditure).
To accomplish this, in professional project management the project is divided into tasks called a Work Breakdown Structure (WBS), a fancy word for a simple thing.
| ID | Task Name | Start | End | Budget |
|---|---|---|---|---|
| 100 | Dig hole | Sep. 1 | Sep. 10 | $10,000 |
| 200 | Pour foundation | Sep. 5 | Sep. 25 | $40,000 |
| 300 | Build house | Sep. 25 | Oct. 25 | $30,000 |
| TOTAL | $80,000 | |||
The baseline is the expected project cost at any intermediate point. It can be graphed to show the trend, and it has a defined value at any point in time.
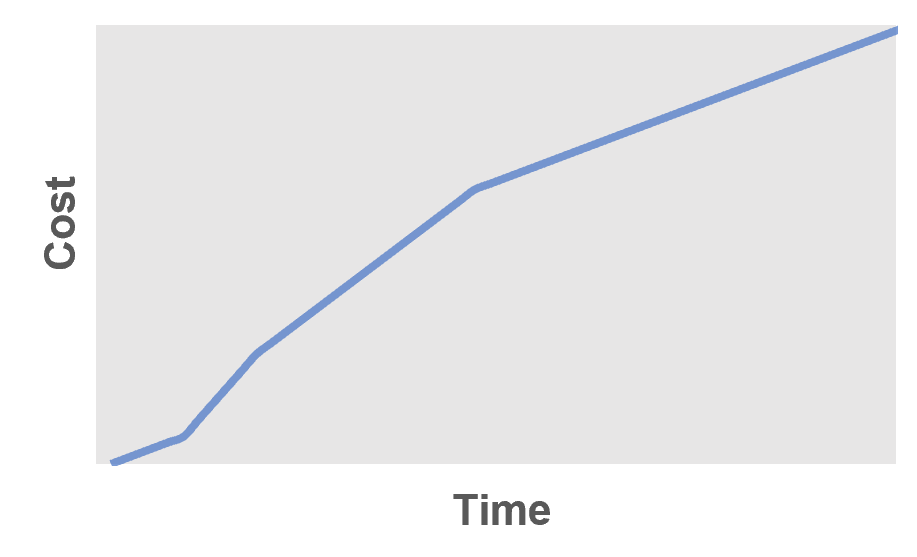
In this example the overall project burn rate is $80,000 / 55 days, or $1,400/day. But it is not uniform. If you look closely, you can see that the burn rate of task 100 is $1,000/day, but for task 200 it’s $2,000/day. Moreover, from September 5 to September 10 both tasks are being performed simultaneously, hence the burn rate is $3,000/day. There might even be specific purchases that result in one time expenditures on the project baseline.
If you needed to report progress to management on day 10 (September 10), the expected cash burn at that point would be $20,000 ($1,000/day for 5 days plus $3,000/day for 5 days). If you had actually burned only $18,000 you would be under budget, despite being above the overall project burn rate of $1,400/day for 10 days, or $14,000.
This example assumes the burn rate of each task is at a uniform, linear rate. If not, the calculation can be made more complex to suit the individual circumstances (for example, one-time purchases of supplies).
The PMBOK Guide specifies this exact process in a method called earned value management. The cost status at any point is calculated in variables called Cost Variance (CV) and Cost Performance Index (CPI).
Project Schedule Baseline
 Project schedules are similar to budgets. Although they are related (the more time you spend, the more money you need, generally speaking) there are some key differences.
Schedules tend be straight lines rather than variable budget baselines. That is, if there are 5 days in the schedule for framing the house, then 1/5 = 20% of the work needs to be complete on each day. If it is not, additional resources can be allocated to get back on schedule, but if the project was estimated correctly those resources would need to spend that amount of time, whenever that occurs.
Back to our example:
| ID | Task Name | Start | End | Budget |
|---|---|---|---|---|
| 100 | Dig hole | Sep. 1 | Sep. 10 | $10,000 |
| 200 | Pour foundation | Sep. 5 | Sep. 25 | $40,000 |
| 300 | Build house | Sep. 25 | Oct. 25 | $30,000 |
| TOTAL | $80,000 | |||
On September 10, the same day as the above example (day 10), the first task should be complete and the second task should be 25% complete, because it is one quarter of the way through it’s expected time slot. The actual percent complete can be measured by parameters such as amount of concrete poured, walls placed, or fenceposts pounded. Often in practice it is measured by hours worked, but this is circular logic – the labor may not have been productive.
The actual amount of work complete is compared to the expected amount complete according to the schedule. This is also covered in earned value management in the calculation of two variables, called Schedule Variance (SV) and Schedule Performance Index (SPI).
Project Scope Baseline
The scope baseline is somewhat different than the other two. Rather than a time-phased performance baseline, the scope baseline represents the project’s work. More than just a scope statement, it is the embodiment of the project work into phases and tasks, hence it is tracked like a baseline. If any tasks require more or less work than envisioned, the baseline is updated.
The scope baseline contains three items:
- The scope statement describes what work is included in the project and what is not. It puts a well defined boundary around the project’s work.
- The WBS breaks down the scope statement into constituent tasks, which are managed individually to reduce complexity and ensure project success.
- The WBS Dictionary is the meta-level information on the WBS. That is, supplementary information on each task, such as required resources, acceptance criteria, and assumptions and constraints.
The project scope should not change. Like a heart monitor during surgery, the scope baseline is horizontal and any deviation is a serious thing that must be addressed immediately by the project manager. Unauthorized work that becomes part of the project is called scope creep and can put your project on life support. Scope issues are one of the biggest causes of project failure.
Earned Value Management
 The earned value method is the standard for project control in project management. It is the undisputed way to measure and report project progress, and its primary benefit is an invaluable early warning signal of the symptoms of project distress.
In this method, four variables are extracted from project data for each task:
- Budget at Completion (BAC) is simply the task’s budget.
- Planned Value (PV) is the expected project budget at the point of analysis (usually today). For example, if on day 2 out of a 10-day long task, the PV = 20% of the task budget.
- Earned Value (EV) is the actual amount complete, ascertained from actual task completion data. For example, if a task is 25% complete, EV = 25% of the task budget.
- Actual Cost (AC) is the actual cost of the task at the point of analysis. Most organizations track this quite well. If not, try to add up receipts or keep track of project expenditures.
Four variables are used to estimate the project status at the point of analysis, that is, whether the task is above, at, or below its baseline:
- Cost Variance (CV) is the actual out-of-budget amount.
- Cost Performance Index (CPI) is the out-of-budget amount relative to the overall project budget.
- Schedule Variance (SV) is the actual out-of-schedule amount.
- Schedule Performance Index (SPI) is the out-of-schedule amount relative to the overall project schedule.
An finally, the last four variables are forecasts for future project performance (as opposed to actual immediate status). Each of these has several calculation options depending on what assumptions are used to extrapolate forward (future performance equals past performance vs. planned performance, etc.):
- Estimate at Completion (EAC) is the expected final project budget.
- Estimate to Complete (ETC) is the expected expenditure from now until the end of the project.
- Variance at Completion (VAC) is the expected final project variance (CV), or out-of-budget amount.
- To Complete Performance Index (TCPI) is the expected final CPI.
As you can see, the earned value method essentially converts the project budget and schedule into a time-phased baseline, and facilitates a standard calculation method that analyzes the project against its baseline at the time of analysis.
Project Change Management
If the project budget, schedule, or scope status at any point deviates from the baseline, you have two choices:
- Get the project back on track, that is, achieve project performance in the future that is on the opposite side of the baseline. A small caution, though, that it is never easy to swing from poor to better-than-expected performance.
- Change the project plan.
In either case, the project plan is the guideline which establishes the stakeholder’s expectations, and constitutes the project baseline. Changing it requires the re-approval of the stakeholders.