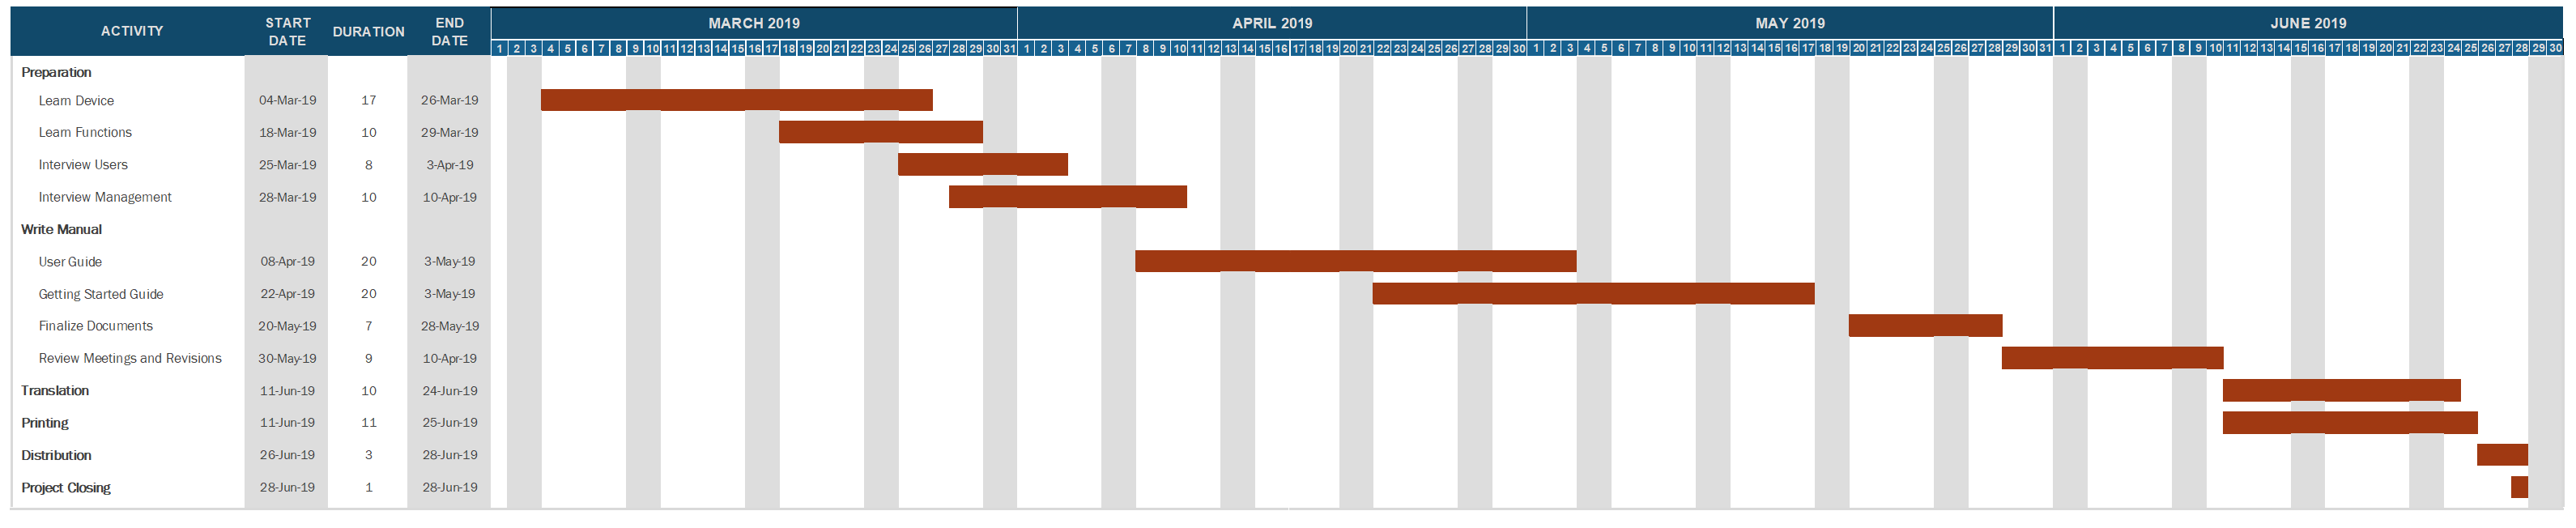
A Gantt chart is a graphical depiction of a project schedule in which project task durations are shown as horizontal bars.
Gantt charts are the easiest and most intuitive way to communicate a project schedule. They are created as part of the Project Management Plan, and give stakeholders an instant picture of what the project is set to accomplish, and when. But they have a few inherent weaknesses, which the project manager must be aware of to use them most effectively.
Parts of a Gantt Chart
To be considered a Gantt chart, as a minimum it needs to have a task list with bars showing start and end dates for each task. But most professional project managers utilize the power of a Gantt chart by including other components.
 These are the parts of a Gantt chart:
- Task List
- Task Duration
- Milestones
- Project Completion Date
- Dependencies
- Resources
- Budget
Task List
In Project Management lingo, the task list is called a Work Breakdown Structure, usually abbreviated WBS. Dividing a project into constituent tasks is the first component of project management, in all three major project management methodologies (PMBOK, PRINCE2, and IPMA).
It may seem trivial, but a strong WBS is the foundation for all other project management and control functions. If the tasks are too small, they risk inefficient micromanagement. If they are too big, they lose the benefit of project control. Ideally, each task should be between 8 and 80 hours of work.
Task Duration
The durations of each task are estimated using the two main estimation techniques:
- Analogous Estimating: The task is compared to other tasks that have been completed. For example, the neighbor built his fence in 2 weeks.
- Parametric Estimating: The task is compared to a unit rate. For example, people in the neighborhood built their fences at a rate of 20 ft per day.
These are combined with three point estimating.
- Three Point Estimating: The process of estimating a task using an optimistic, pessimistic, and most likely estimate. This is a very intuitive estimating method whereby the Optimistic and Pessimistic estimate are determined and one of two methods are used to determine the overall estimate:
- Normal Distribution (average): Estimate = (Optimistic + Most Likely + Pessimistic) / 3
- Beta Distribution: Estimate = (Optimistic + 4 x Most Likely + Pessimistic) / 6
Each task estimate is rolled up into the overall project estimate using either Top Down or Bottom Up Estimating.
- Top Down Estimating: The estimate for the entire project is determined first, and proportioned into the tasks according to finite percentages, or from percentages from the individual tasks.
- Bottom Up Estimating: The estimate for the entire project is the sum of the individual task estimates.
Milestones
 Project milestones are similar to tasks, except that they have no duration. They are like the finish line that the marathon runner runs through.
At any given time, the project has either achieved the milestone, or has not.
On the Gantt chart, milestones can be represented with either:
- A task bar, but with a single day (or unit) duration.
- A milestone marker, such as a star
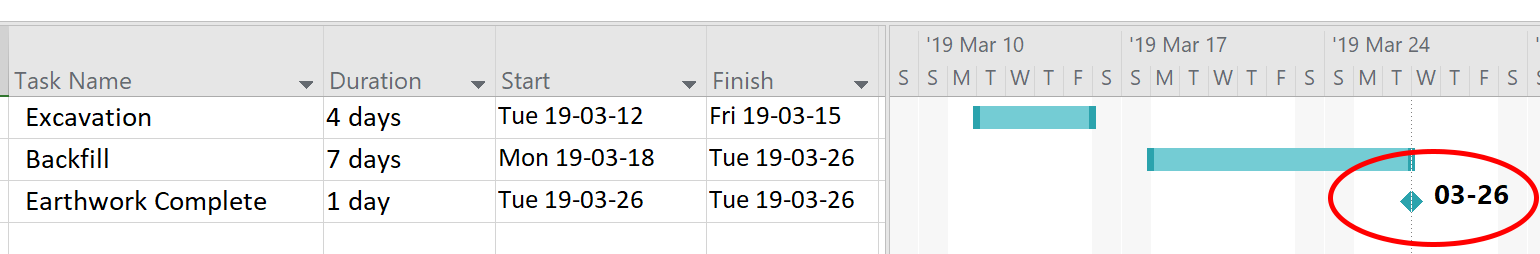
Here is an example of a milestone on a Gantt chart, using Microsoft Project:
Project Completion Date
The overall project completion date is a milestone – Nothing more, nothing less. But it is unique in that it is the last milestone, which represents the completion of all project activities.
Since the very definition of a project is as a temporary endeavor, with a finite beginning and end, the project completion date is almost always an important consideration in project success.
The project completion date is very easy to see on most Gantt charts, and indeed, most stakeholders’ eyes wander into the bottom right corner of the chart relatively quickly. This visualization of the project is one of the strongest aspects of Gantt charts.
Dependencies
In a perfect world, all tasks of a project are dependent on one another. If they weren’t, they wouldn’t be a part of the project.
For example, you can’t start the party until the cake is done.
In fact, this demonstrates the most common type of task dependency. And since project managers are generally not show business types, we call it simply, Finish-to-Start. That means that the task cannot begin until the prior task completes.
There are four types of dependencies:
- Finish to Start (FS): Task B cannot start until Task A finishes. This is the most common.
- Finish to Finish (FF): Task B cannot finish until Task A finishes.
- Start to Start (SS): Task B cannot start until Task A starts.
- Start to Finish (SF): Task B cannot finish until task A starts. This one is rare.
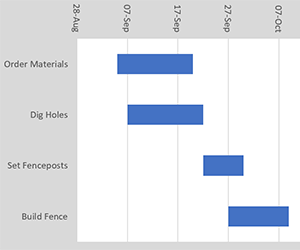
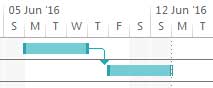
On the Gantt chart, task dependencies are shown as an arrow from one task to the next. Here is a typical Finish-to-Start dependency from Microsoft Project:
Resources
Although the Gantt chart is a project manager’s most important tool, its biggest weakness is in the management of project resources. This is because it’s difficult to see what resources are required by the task. The Gantt chart doesn’t readily show what resources are required to carry out the task, and if those resources are delayed, the task might be delayed.
For example, if Bob and John need 40 hours of work to complete a task, you might be inclined to allocate 1 week on the Gantt chart for that task. But the project might need them in other areas during that time. Or another project might need them. It is remarkably easy to overextend your resources on the Gantt chart.
Another common scenario is that the Gantt chart leads to inefficient utilization of resources. For example, let’s say you need an Excavator for tasks in week 1 and in week 3. You should probably consider moving the two tasks closer together, and sacrificing other timelines, resources, or budgets to avoid having an idle excavator at the site. Again, the Gantt chart does not readily show you this inefficiency.
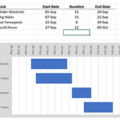
This problem is most often overcome by labeling major resources on the Gantt chart. They can be either listed as a column beside the task list, or they can be shown beside the bar. Here is an example of resources shown beside the bar:
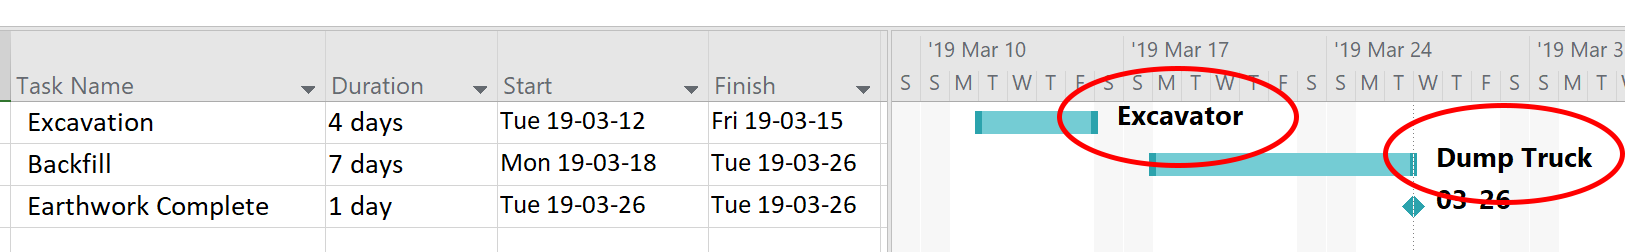 It’s a bit cumbersome, but it allows for better visualization of the important resources.
Budget
Time is money. In business, and especially in project management, these two factors are inexplicably linked. They are joined at the hip.
Each task has a budget, and if the actual completion date of the task is late, the budget is also most likely exceeded. For this reason, it is extremely important for the project manager to:
- Notice the variance as early as possible
- Act upon the variance as soon as possible
Therefore, the budget is often displayed on Gantt charts. It can be displayed as either a separate column beside the task list, or beside the bars. Of course, those are the same two places where the resources are shown (see above) so one must be careful to display the information that you wish where you want it on the gantt chart.
Good luck with your Gantt charting, and let me know about your tips and tricks in the comments section below.