A Gantt chart is a horizontal bar chart showing the start and end dates of each task within a project. It shows the tasks on the vertical axis and time on the horizontal axis. The tasks are shown sequentially. It can have many other pieces but these are the basic building blocks.
Gantt Chart Example 1
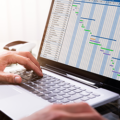
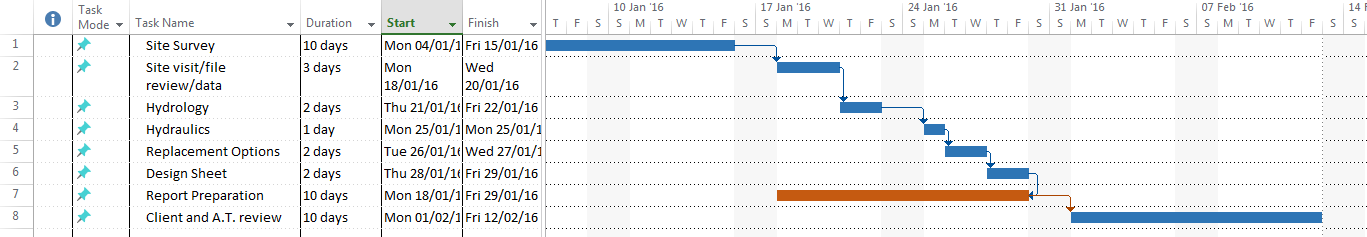
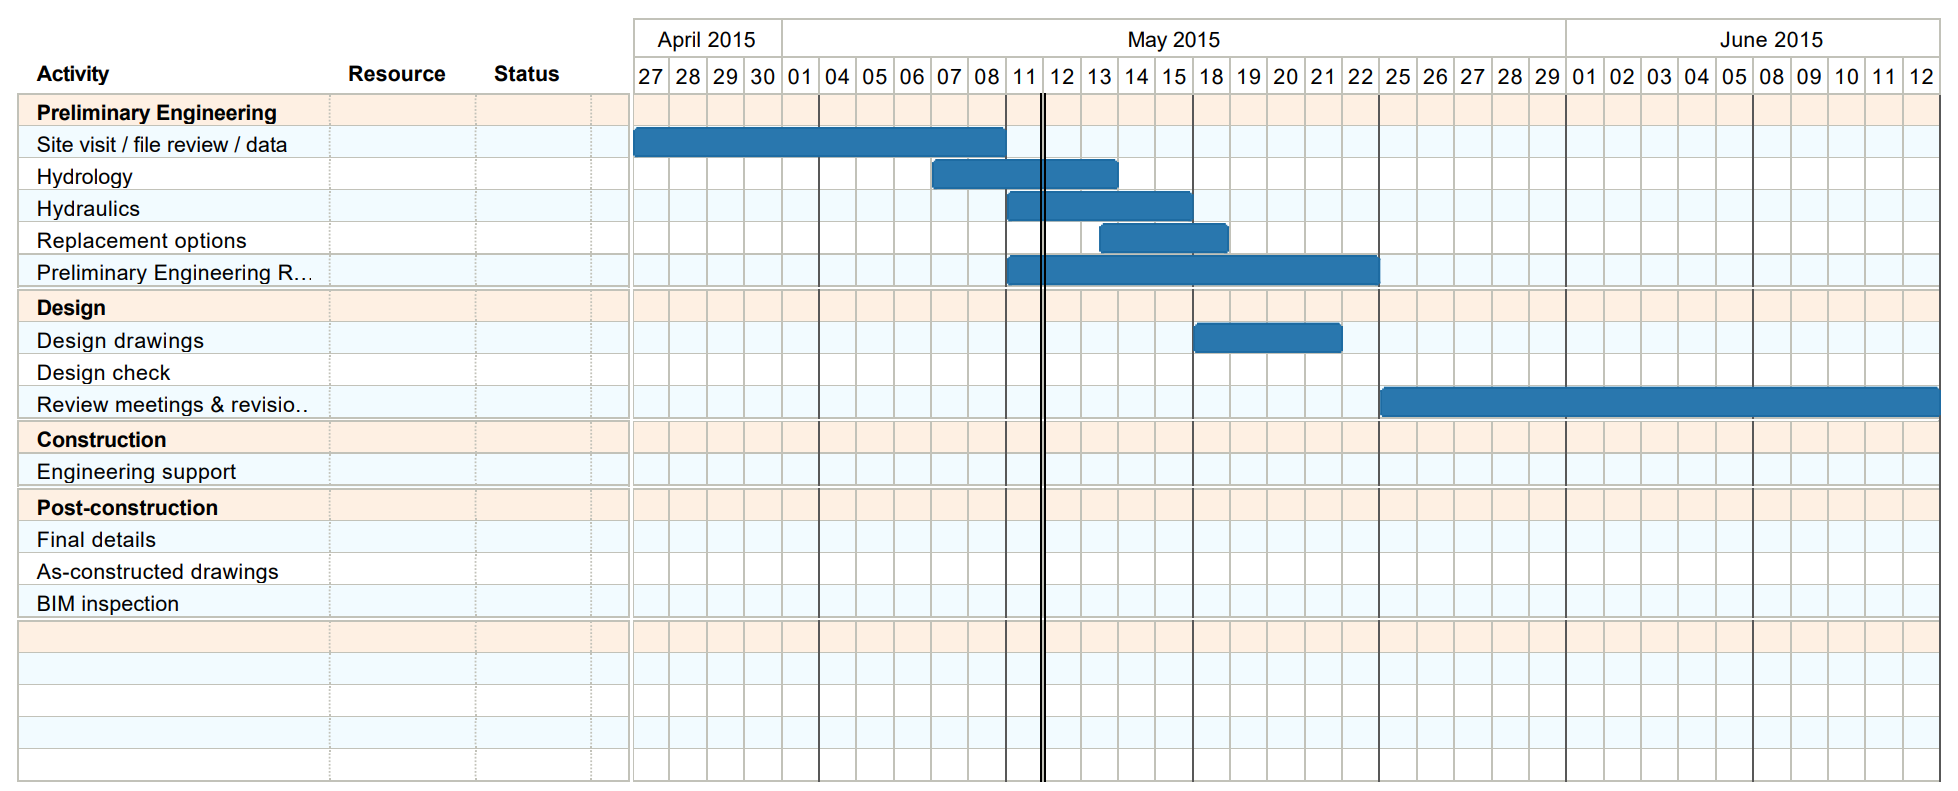
Here is a Gantt chart that was created with Microsoft Project.
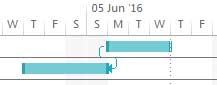
Gantt Chart Example 2
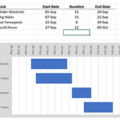
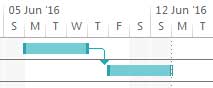
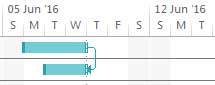
This example was created in Tom’s Planner (www.tomsplanner.com).
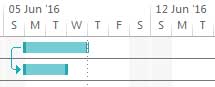
Gantt Chart Example 3
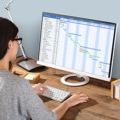
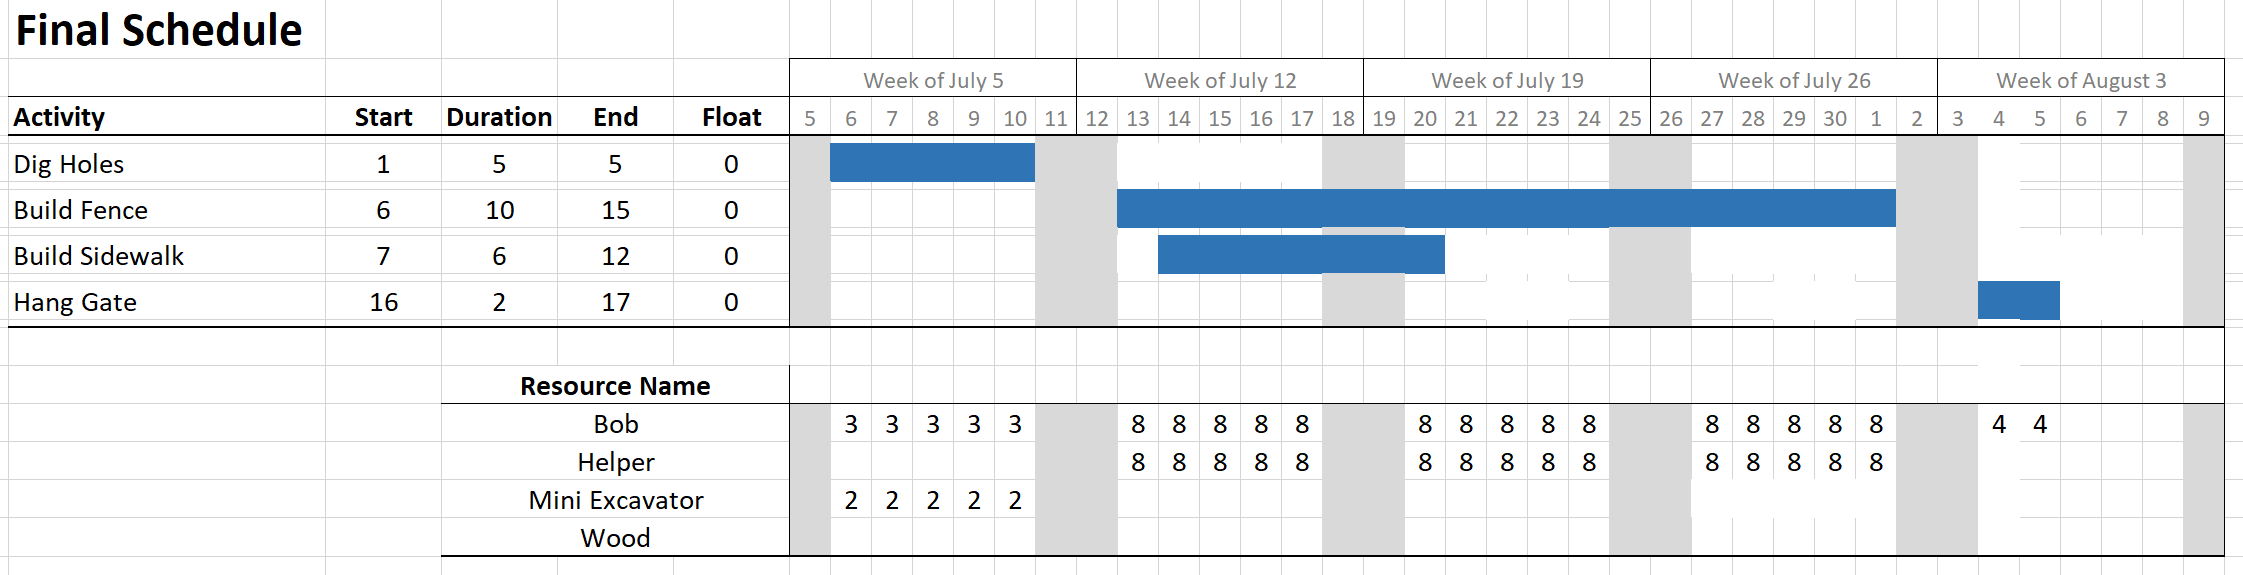
This Gantt chart was created with Microsoft Excel.
Parts of a Gantt Chart
As a minimum, to be considered a Gantt chart it must contain the following two things:
- A listing of tasks
- A bar representing start and end dates for each task.
Other items that can be used are:
- Phases: The tasks can be grouped into phases. This is core functionality for any strong gantt charting software, because most projects have more than about 10 tasks, at which point it gets unwieldy and difficult to manage when all tasks are on the same level.
- Task dependencies: The relationships between tasks are displayed as arrows from one task to the next. This makes it clear how the tasks are related to each other, and allows for easy analysis of different scenarios on the project. There are 4 types of task dependencies:
- Finish-to-Start: Task B cannot start until Task A is complete. This is the most common.
- Finish-to-Finish: Task B cannot finish until Task A is complete
- Start-to-Start: Task B cannot start until Task A has begun
- Start-to-Finish: Task B cannot finish until Task A has begun. This one is rare.
- Finish-to-Start: Task B cannot start until Task A is complete. This is the most common.
- Critical Path: Defined as those tasks that define the completion date of the project, the tasks that are on the critical path must receive a favorable share of the project manager’s attention because of their larger influence on the overall project completion date. Thus it is important that those tasks are highlighted in some way. Common ways to show the critical path tasks on a Gantt chart include:
- Different color bars
- Bold face font
- Any simple identification of a task on the chart will work.
- Resources: Because the availability of resources can make or break a project schedule, some gantt chart software lists the resources beside the task name. That way, the project manager can be keenly aware of the need to manage those resources in order to ensure the task finishes on time. They can be displayed as a column on the left side (beside the task name) or beside the bar on the right.
- Budget: Although the gantt chart is primarily focused on time rather than budget, these two variables are generally speaking, inseparable. Adding time to the project tends to increase costs, and adding costs tends to increase the time required. And because the Gantt chart is an amazing visual tool for the project schedule, adding a side-by-side visualization of project costs adds a tremendous degree of project management and control. Additionally, if earned value analysis is used to track the schedule, the budget is instrumental in identifying problem tasks that need attention. The budget is generally displayed as a column beside the task name.
- Earned value metrics: If earned value analysis is used as the project control method, several variables are calculated which show the project manager the status of the project, from the schedule as well as cost, perspective. Metrics such as the Schedule Performance Index (SPI), which identifies the percentage that the project is ahead of, or behind, schedule, and Variance at Complete (VAC), which forecast the final completion budget, could be displayed on the Gantt chart to provide a strong picture to the project manager. Professional project managers always have their preferred earned value metrics handy, and the gantt chart is a great place to show them.