A Gantt Chart is to a project manager like a hammer is to a carpenter.
It is the project manager’s most used tool. It is used to convey the most critical information. And it plays an outsized role in project success.
Since a project is by definition temporary, the completion date is a critical item in virtually every project. The gantt chart is used during project planning to determine the completion date, as well as during project execution to ensure it is met.
Just like good carpenters keep their tools in great shape, good project managers look at their gantt chart every day, and ensure the critical path tasks are on track.
What is a Gantt Chart?
 In project management, a Gantt Chart is a bar chart of the project schedule which uses horizontal bars to illustrate the start and finish dates of each task. It provides a quick overview of the project schedule to stakeholders. It is an important component of the Project Management Plan. It can also illustrate the relationships between project tasks.
A Gantt chart is an amazing way to communicate information to project stakeholders. In one chart, you can communicate the following information:
- The task list
- Task start and end dates
- Task durations
- The project start and completion dates
- Project milestone dates
- The project completion date
The Gantt chart is truly a picture that is worth a thousand words. But it has limitations which you should known about, in order to use it effectively.
How to Create a Gantt Chart
There are many software options available for creating a Gantt chart. From MS Excel to web based options, each one has its pros and cons. The best way is to learn to use one piece of software and stick with it.
- Microsoft Excel: Although possible, using a spreadsheet requires some advanced knowledge of charting features. However, if you are an advanced user, it is a fast option that has many formatting possibilities. One can use either the Bar Chart feature, or manually draw the chart using background colors for the bars. The former is faster, but doesn’t provide a strong, professional result. The latter is slower but can be customized almost infinitely.
- Microsoft Project: Experienced project managers in many industries use Microsoft Project, which can create Gantt charts in minutes and can keep track of task dependencies, float, and earned value progress.
- Online Software: These are the norm in the software development industry – it’s fast, customizable, and easy to share with a project team. Choosing the right one depends on the level of sophistication you need (task dependencies, earned value reporting, importing/exporting etc.) and the required features. Since there are many poor quality options out there, we include the following list of the Top Ten web based project management software, which are well established and have a large customer base. Our recommended list is:
- Wrike (www.wrike.com)
- Zoho Projects (www.zohoprojects.com)
- Monday (www.monday.com)
- Tom’s Planner (www.tomsplanner.com)
- Asana (www.asana.com)
- Smartsheet (www.smartsheet.com)
- ProjectManager.com (www.projectmanager.com)
- Mavenlink (www.mavenlink.com)
- ProWorkFlow (www.proworkflow.com)
- Workzone (www.workzone.com)
- Industry Specific: Most industries have specialty software that is prominent, such as Primavera P6 in the construction industry. These tend to be expensive and require investment in training, but they can give you credibility in the industry you’re working in.
Work Breakdown Structure
Gantt charts represent the culmination of the project scheduling process.
In the Project Management Body of Knowledge (PMBOK) as well as in the PRINCE2 and IPMA methodologies, project management begins with the separation of the project into tasks. These tasks should be between 8 and 80 hours of work. Too small, and the project is being micromanaged, creating large overhead with little benefit (and frustrated team members). Too large, and the project tracking mechanisms become less effective (there is little difference between a large task and a large project).
This separation of the project into constituent tasks is called a Work Breakdown Structure, more commonly abbreviated WBS.
Here is a sample WBS for a fence building project:
| Work Breakdown Structure – Build Fence | |
|---|---|
| Task ID | Task Name |
| 100 | Dig Holes |
| 200 | Build Fence |
| 300 | Build Sidewalk |
| 400 | Hang Gate |
Tasks should be named with a verb then a noun, if possible. For example, it is often intuitive to call a task “Holes” or “Gate” but a simple noun adds substantially to the readability of the project plan – “Dig Holes” or “Hang Gate,” as I’ve done above.
The Work Breakdown Structure is like the frame of a house. The carpenter must build it carefully because many components depend on it. But the real structure of the Gantt chart is the task durations.
Task Estimation
To determine the length of the bars on the Gantt chart, the task durations must be estimated. There are two primary estimation techniques:
- Analogous Estimating: The task is compared to previous tasks that have already been completed. For example,
When the neighbor built his fence the holes took 5 days to complete. - Parametric Estimating: The task is compared to unit rates, These can be from personal experience but are often published by industry authorities and result from a general average of all the factors that go into that work. For example,
The local construction association estimates that you can dig 5 fencepost holes per hour.
These can be used in conjunction with three point estimating, which is a brilliantly intuitive way to use an optimistic and pessimistic estimate to determine a final estimate. The final value can be taken as either the average:
Or, if it is desirable to keep the estimate tighter to the average, the beta distribution can be used:
Where:
- te = estimate
- a = Optimistic Estimate
- m = Most Likely value
- b = Pessimistic Estimate
Using a process called Bottom Up Estimating, the tasks are added to the WBS.
- Bottom Up Estimating: The process of aggregating the estimates of lower level components of the Work Breakdown Structure into an overall project estimate.
This is done via the addition of a column on to the WBS table:
| Work Breakdown Structure – Build Fence | ||
|---|---|---|
| Task ID | Task Name | Duration |
| 100 | Dig Holes | 5 |
| 200 | Build Fence | 10 |
| 300 | Build Sidewalk | 5 |
| 400 | Hang Gate | 2 |
At this stage, you could plot the tasks and durations on a Gantt chart.
But the true power of the Gantt chart lies in the project efficiency, that is, the ability to plan simultaneous tasks, schedule project resources, and minimize the project’s completion date. That’s where task dependencies come in.
Task Dependencies
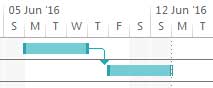
There are four types of dependencies between project tasks. Each of these are depicted on the Gantt chart with an arrow from one task to the other.
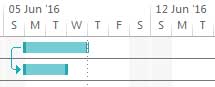
- Finish-to-Start: This is the most common. Task A must be complete before Task B begins.
- Finish-to-Finish: Task A must be complete before Task B can be complete.
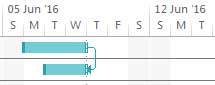
- Start-to-Start: Task A must have started before Task B can start.
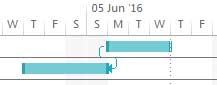
- Start-to-Finish: Task A must have started before Task B can finish. This one is quite rare.
These dependencies are added to the WBS as predecessor tasks, like this:
| Work Breakdown Structure – Build Fence | |||
|---|---|---|---|
| Task ID | Task Name | Duration | Predecessors |
| 100 | Dig Holes | 5 | |
| 200 | Build Fence | 10 | 100 |
| 300 | Build Sidewalk | 5 | 100 |
| 400 | Hang Gate | 2 | 200,300 |
All tasks have a predecessor (or a predecessor from it). If you don’t need to perform the task to complete the project, then it shouldn’t be part of the project.
The tasks are now linked together which allows for an impressive level of project scheduling and planning.
However, there is still one missing piece. Some of the tasks might be able to proceed in parallel with other tasks, shortening the schedule. How does one maximize the efficiency of the project tasks? The answer is the Network Diagram.
Network Diagram
Because the critical path tasks and task floats cannot be calculated from a Gantt chart, the Network Diagram is used to determine the float of each task.
In project management theory,
- Critical path is the sequence of tasks which determine the completion date of the project. If a critical path task requires longer than expected to complete, the completion date of the overall project is lengthened by the same amount.
- Float, also called Slack, is the amount that a task can finish late without affecting the completion date of the project. Critical path tasks have zero float.
If a task is on the critical path, it should be watched studiously to ensure it completes on time, because if it does not, the overall project completion date will have to move by the same amount.
In the same way, tasks that have float have some room to move, and can be managed accordingly.
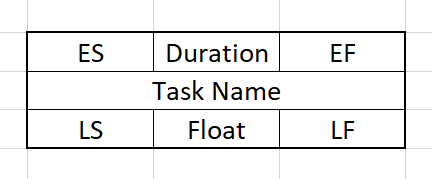 To construct a network diagram, each task is given a box which displays the following information:
- Duration: The task duration, calculated earlier, is the primary input into the process.
- Early Start (ES): The earliest possible date that the task can start.
- Late Start (LS): The latest possible date that the task can start.
- Early Finish (EF): The earliest possible date that the task can finish.
- Late Finish (LF): The latest possible date that the task can finish.
- Float: The amount that the task can “move” (float) without affecting the completion date of the project.
Float = Late Finish – Late Start
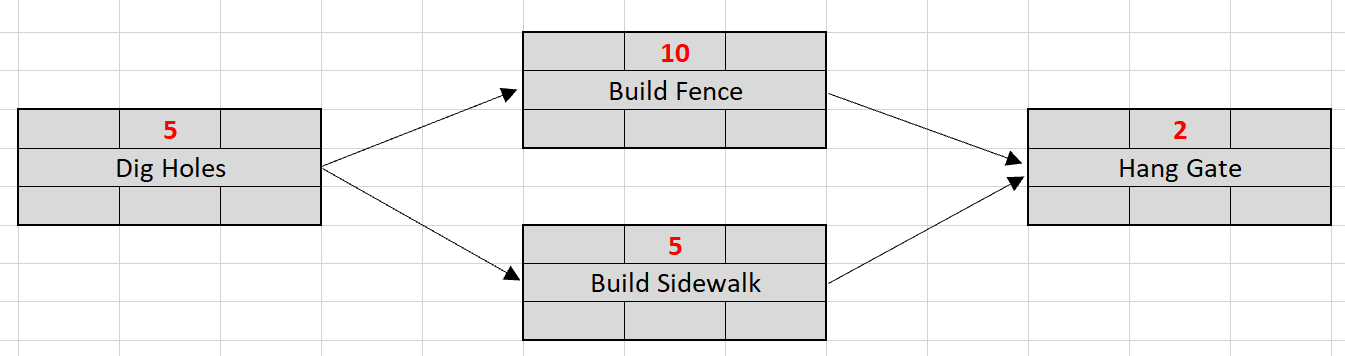
The process of creating a network diagram is as follows:
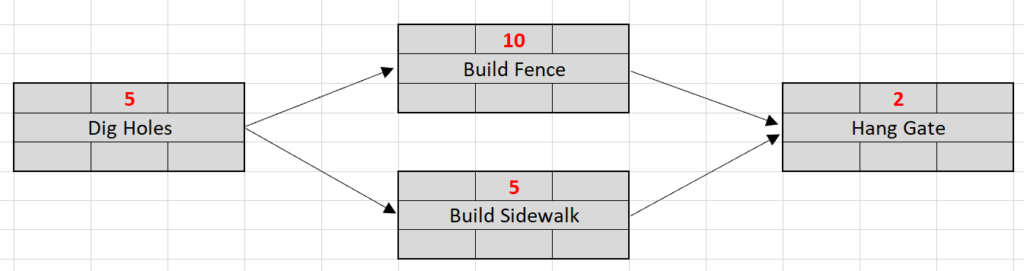
- Enter the durations of each task in the top, middle box. These have been previously determined, in the estimating step.
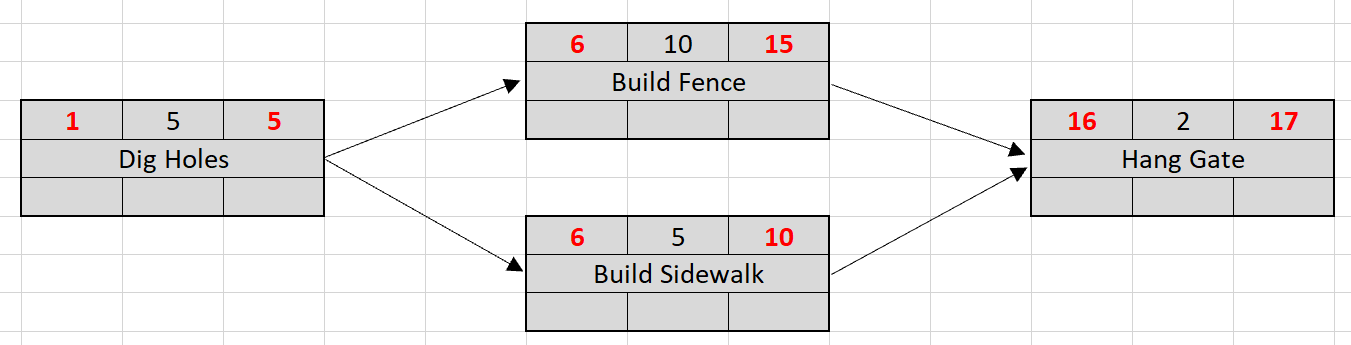
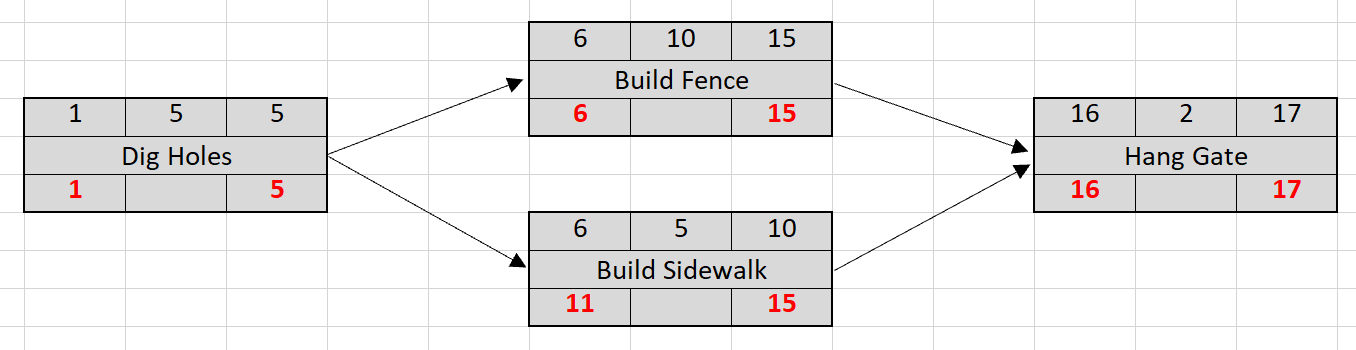
- Perform a Forward Pass to determine the project completion date:
- Enter the number “1” into the top left box of the first task. This means that it starts on Day 1.
- Determine the Late Start (LS) of the first task by adding the duration and subtracting 1. This is because the end date is inclusive of the task duration.
LS = ES + Duration – 1
- The Early Start of the following task is simply the day after the previous task completes. When you have two LS’s to choose from, pick the higher one.
ES2 = LS1 + 1
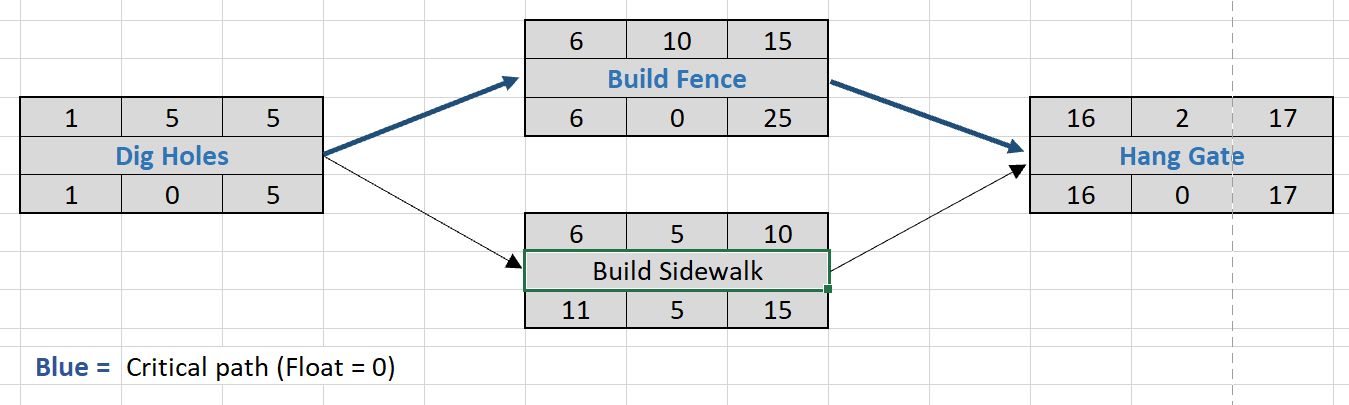
- Repeat this process throughout the other tasks in the network. Here is the result:
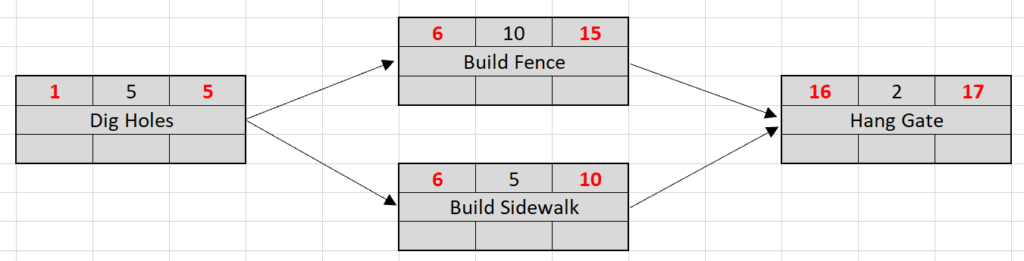
Hence, the project completion date is on Day 17.
- Perform a Backward Pass to determine task floats:
- Choose the LS from the final task and enter it into the Late Finish (bottom right) box. If there are multiple final tasks, choose the highest LS and enter it into the LF for all final tasks.
- Calculate the Early Finish (bottom left) of the final task by subtracting the task duration. Once again, the start and finish dates are both inclusive of the duration, so you need to add one.
EF = LF – Duration + 1
- The LF of the previous task is simply one less than the later task. When you have two or more LF’s to choose from, pick the lower one.
EF1 = LF2 – 1
- Repeat this process throughout the other tasks in the network.
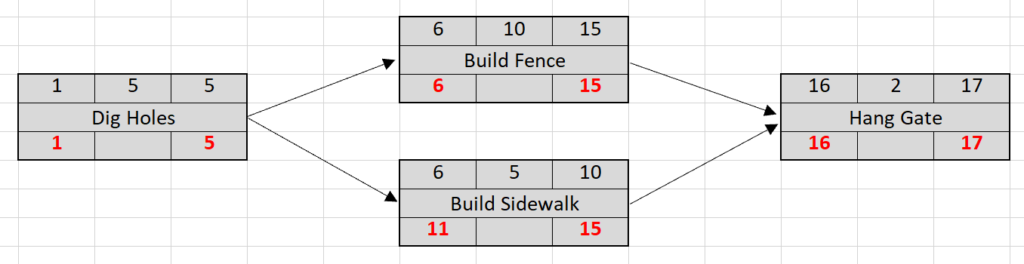
- Enter the floats in the bottom, middle box for each task
Float = EF – ES
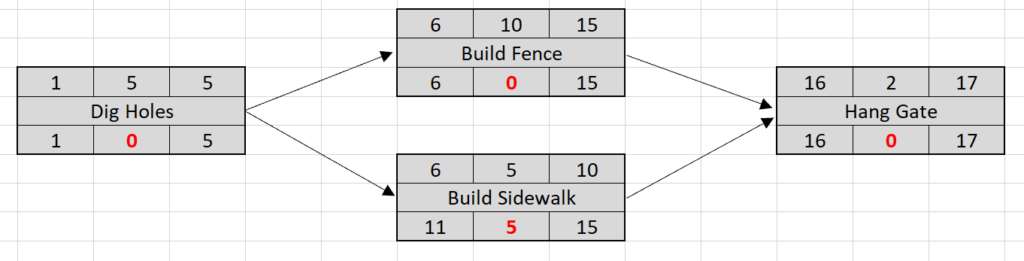
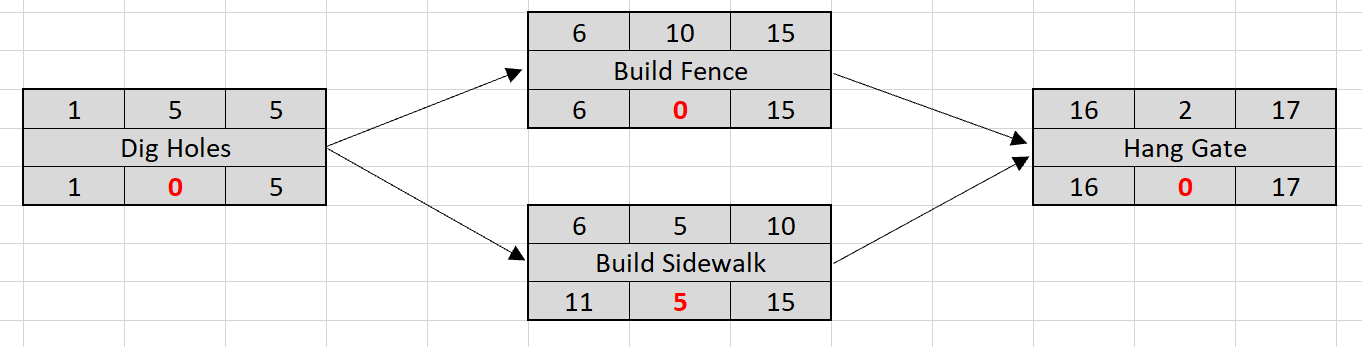
Tasks that have zero float are on the critical path. In this case only the “Build Sidewalk” task is not on the critical path. It has a float of 5 days.
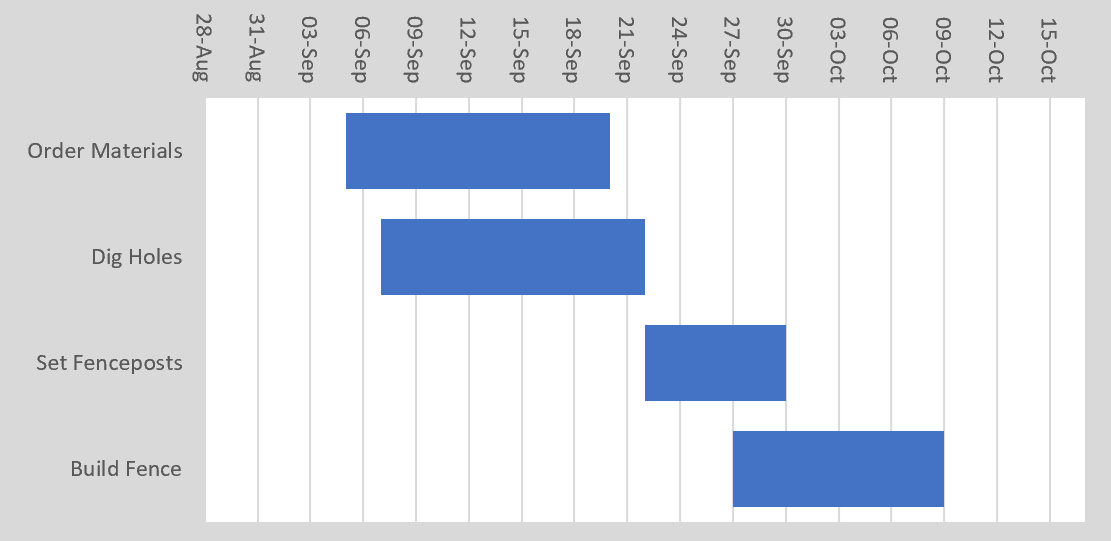
Producing the Gantt Chart
The network diagram tells you where to put the start and end dates of each task on the Gantt chart.
- The start date can be anywhere between the Early Start (ES) and Late Start (LS) date.
- The finish date can be anywhere between the Early Finish (EF) and Late Finish (LF) date.
Tasks that have zero float are fixed. They are on the critical path.
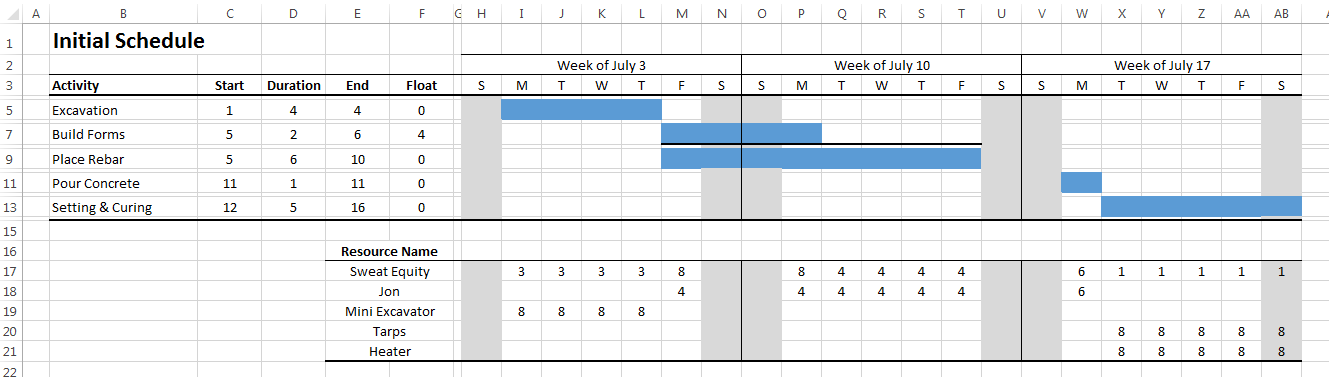
This is what the initial Gantt chart looks like:
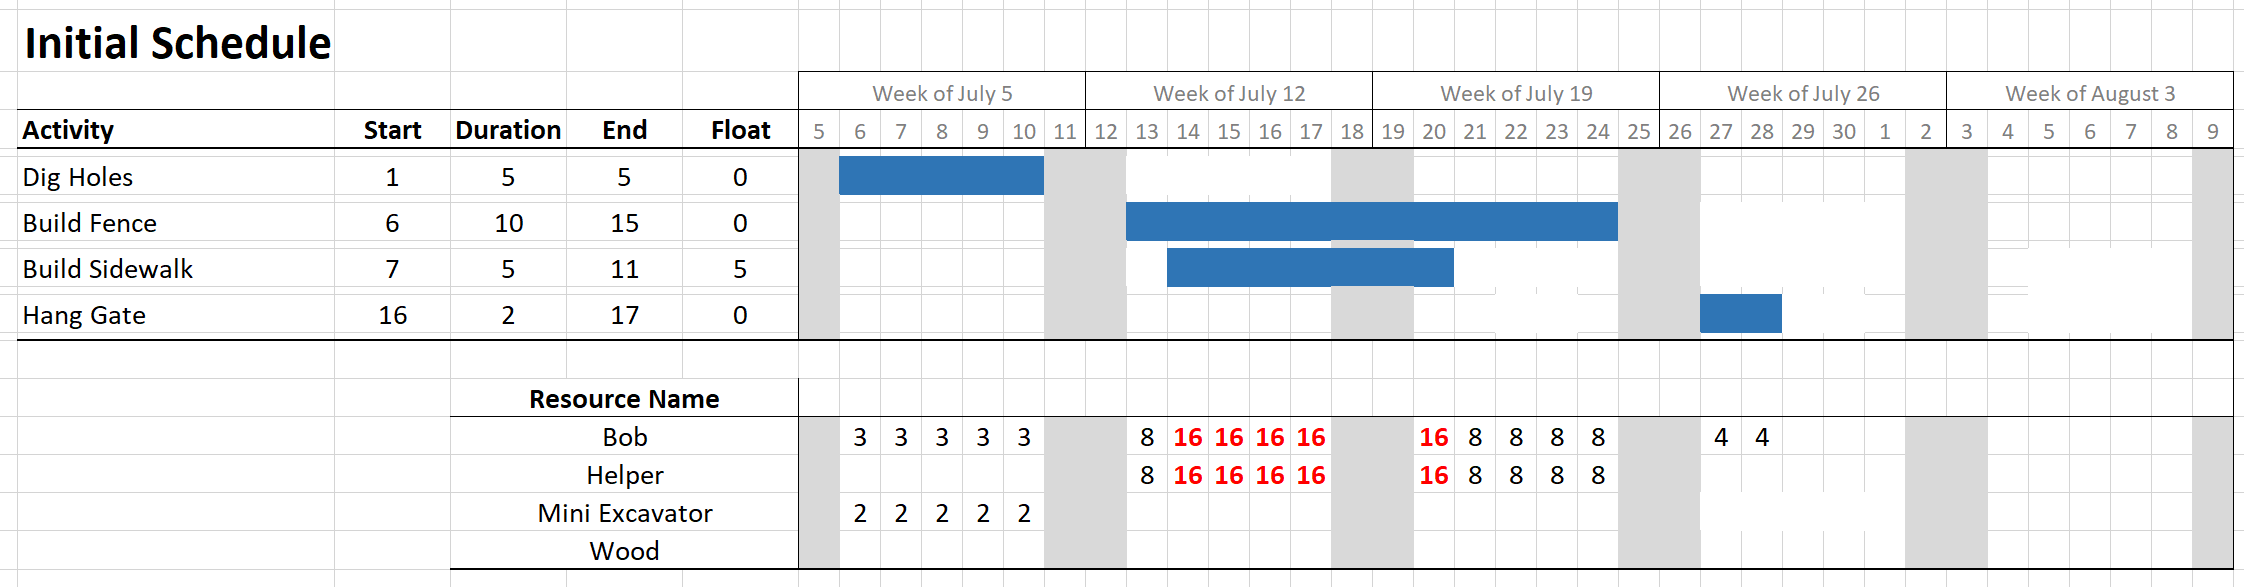
Notice how Bob and his helper are overextended (highlighted in red) for five days because the Gantt chart did not account for resource conflicts. Gantt charts do not take into account the availability or efficient use of resources. That’s where Resource Leveling comes in.
Resource Leveling
Gantt charts have an inherent weakness in the visualization and management of project resources.
For example, if it takes an excavator 40 hours to perform a task, you would intuitively enter 5 days on the Gantt chart. But it might be more efficient (and cheaper) if the excavator is used for another task as well, or for the operator to get out and perform other project tasks. In either of these cases, the Gantt chart requires more than 5 days for that task.
Likewise, if you need 2 laborers one week and 6 laborers the next, the schedule could be adjusted to require 4 laborers continuously, saving money. But the Gantt chart does not readily show you this potential efficiency.
When using Gantt chart software, you must be continuously aware of this limitation. Most software will allow you to enter resource units for each task and then notify you if resources are overextended, or even do the resource leveling for you. But in practice, you must take it one step further. Professional project managers always look at their Gantt charts with the view of maximizing the efficiency of resource usage.
Thus, resource leveling is the process of “smoothening” (leveling) the project resource usage rates to lower the project costs.
To perform Resource Leveling, we will use a secondary axis (vertical) to display each project resource. The resources were already estimated at the task estimation stage. We simply put the resources into the space for each task and add them up. The procedure is as follows:
- Display a listing of the resources below the Gantt chart.
- Enter the usage of each resource below the task. Where there are two tasks happening simultaneously, add the resource usage together.
- Where resource usage is unacceptable or could be made more efficient, either:
- Lengthen the duration of the task until the resource usage is acceptable.
- Acquire additional resources and keep the task duration the same
- Any combination of the above
The Gantt chart bars are lengthened until the average resource usage is acceptable. In our example, either one of the tasks could be extended to lower Bob’s and the helper’s hours down to 8 per day.
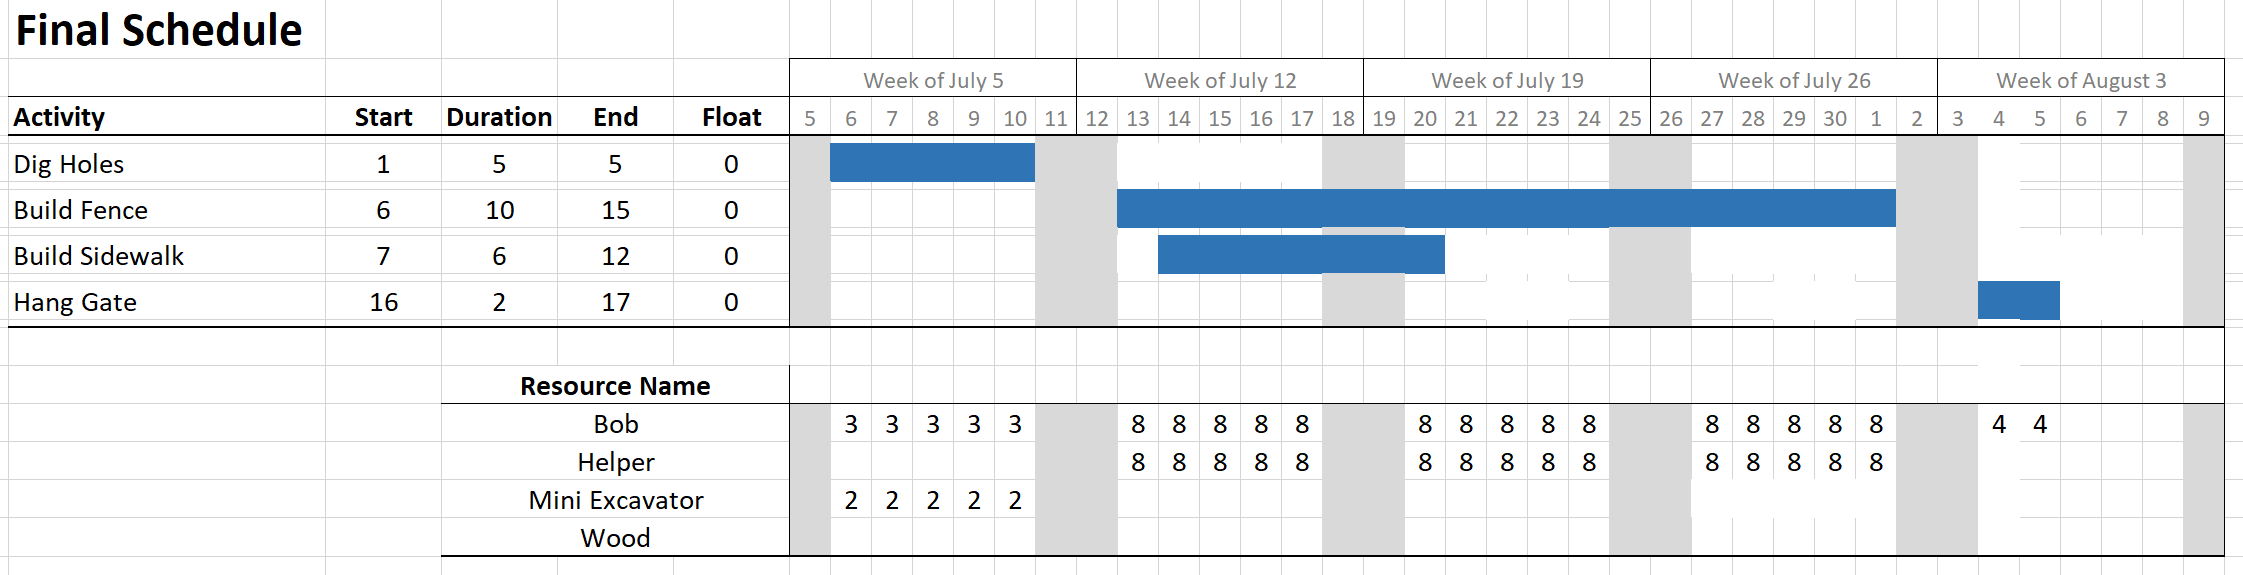
That completes the production of a Gantt chart.
As you can see, it is far easier and quicker to use software to produce it, which can take care of task dependencies and resource levelling for you. Professional project managers use the Gantt chart complete with task dependencies, task budgets, resource levelling, and all the bells and whistles I’ve described.
But that’s not all! Once the project is in its execution phase the Gantt chart is used to track progress against each task using a process called Earned Value Analysis.
How to Use the Gantt Chart to Meet Deadlines
In project management methodology, the earned value method is used to prevent deviations from the project schedule. Like the carpenter that uses the correct plans, the Gantt chart is used as the measuring stick against which progress is compared.
At predetermined intervals, usually one week, the following three variables are determined from project progress:
- Planned Value (PV): The elapsed time for each task, expressed as the task budget. For example, if a task is scheduled to last from June 1 to June 10, and it’s June 3 today, PV = 30% of the task budget.
- Earned Value (EV): The actual progress on the task. For example, if the task is 25% complete, EV = 25% x Task Budget.
- Actual Cost (AC): The actual cost of the task to date.
From these, four variables are calculated which communicate the current project status.
- Schedule Variance (SV): The amount of deviation from the project schedule, expressed as a project budget.
SV = EV – PV - Schedule Performance Index (SPI): The amount of deviation from the project schedule, expressed as a percentage of the project budget.
SPI = EV / PV - Cost Variance (CV): The amount of deviation from the project budget.
CV = EV – AC - Cost Performance Index (CPI): The amount of deviation from the project budget, expressed as a percentage of the project budget.
CPI = EV / AC
These variables tell you if the project is ahead or behind schedule at the time of analysis (usually right now), but the following four variables extrapolate the previous project performance into the future, to estimate the final project performance under various scenarios:
- Estimate to Complete (ETC): The required remaining budget to finish the project.
- Estimate at Completion (EAC): The estimated final project cost.
- Variance at Completion (VAC): The estimated final Cost Variance (CV), that is, the estimated amount that the project will be over or under budget.
- To Complete Performance Index (TCPI): The Cost Performance Index (CPI), that is, the efficiency level that will allow the project to finish on budget.
The project manager (usually, their project management software) calculates these variables daily, weekly, or on some regular schedule to determine the health of the project, and to aid in making decisions that get it back on track.
Parts of a Gantt Chart
As a minimum, Gantt charts must contain the following two things:
- A listing of tasks
- A bar representing start and end dates for each task.
Other items that can be used are:
- Task dependencies: The relationships between tasks can be displayed as arrows from one task to the next. This makes it very clear which tasks are dependent on one another, and easily assess the impact of different scenarios on the project.
- Critical Path: The critical path can be depicted via different color bars, bold face font, or any other simple identification of those tasks on the chart. This makes it very easy to see which tasks must receive extra attention to ensure they complete on time.
- Resources: Some project managers list the resources beside the task name. The presence (or absence) of a major resource (tool, equipment, etc.) can have a substantial impact on the schedule. Listing the resources ensures that the procurement of the resource is top-of-mind even before the task starts.
- Budget: The estimated cost of each task, displayed beside the task name. The budget is a helpful piece of information, and since project control (earned value analysis) most often happens with the gantt chart in front of you, the budget allows for easy hand calculations and/or big picture viewpoints of the health of the project.
- Earned value metrics: After performing earned value analysis, metrics such as Cost Performance Index (CPI), or Variance at Completion (VAC) can assist in reporting the health of the task, as well as the overall project. Although these can clutter up the task list if too many of them are displayed, it can be very helpful to present a gantt chart to senior management together with earned value metrics to communicate the health of the project.
Gantt Chart Example
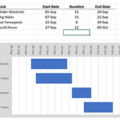
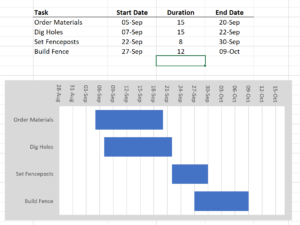
Here is a Gantt chart created with Microsoft Excel.
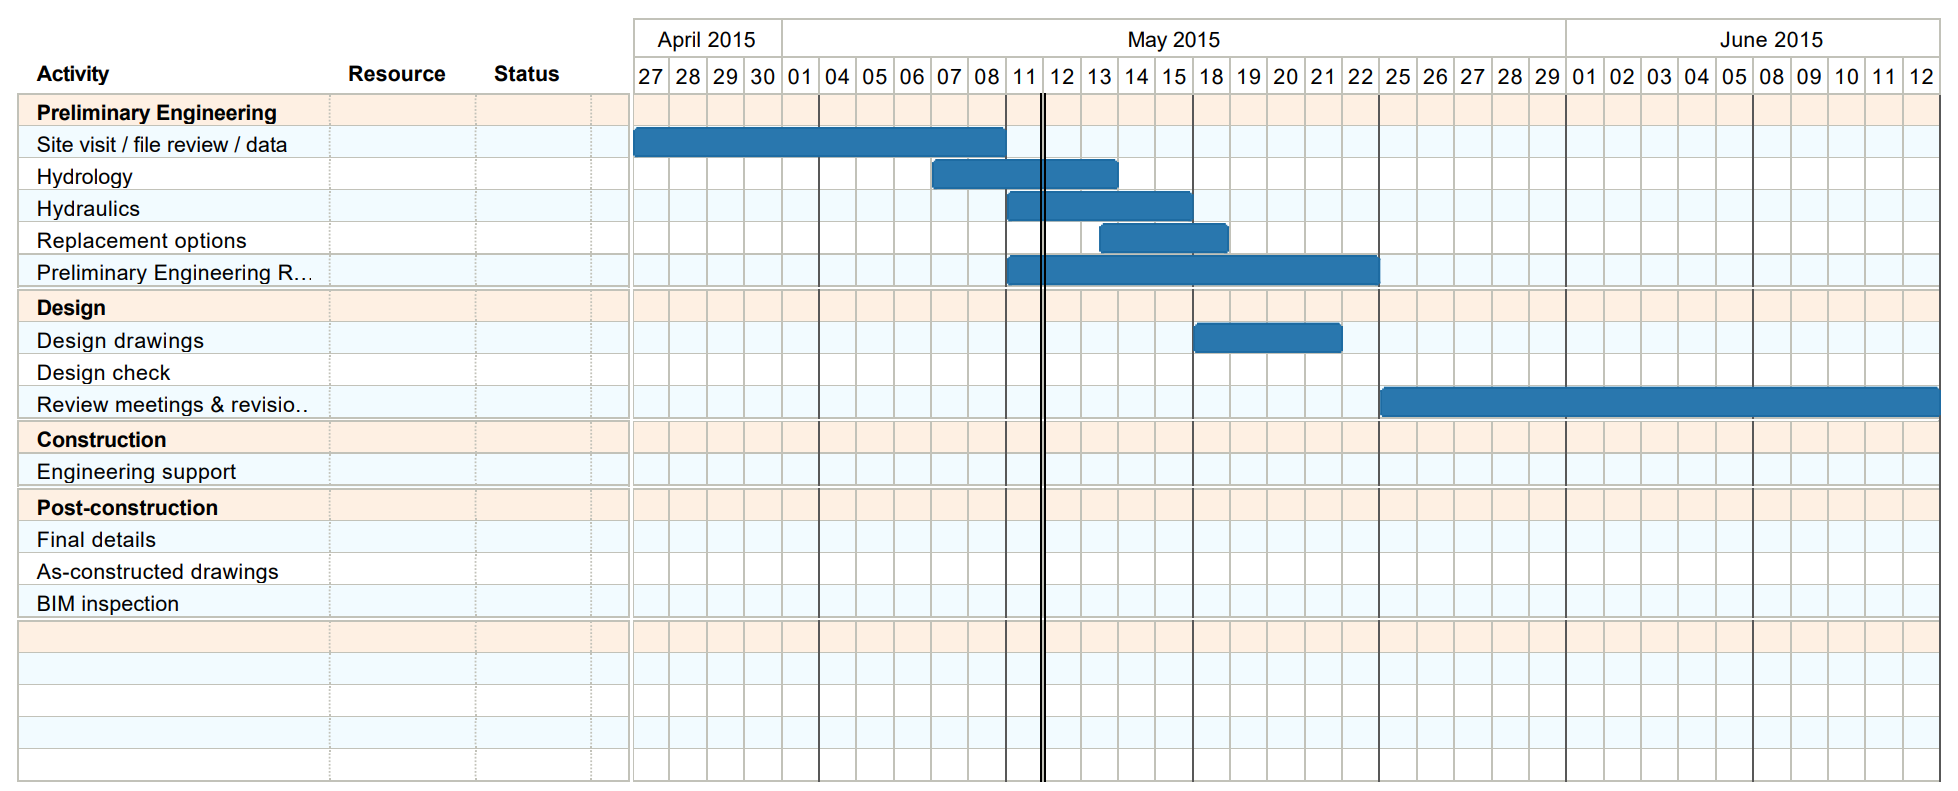
Here is a Gantt chart produced with Tom’s Planner:
Creating a Gantt Chart in Excel
Creating a gantt chart with Microsoft Excel is not only possible, it can result in significant time savings. In fact, if you need a gantt chart in the fastest possible time, MS Excel is your friend. However, you need to know a few key steps that are considered advanced.
The following procedure is for MS Excel 2018:
 Enter the tasks into the spreadsheet, in table form, with the following four columns:
- Task Name
- Start date
- Duration
- End date
- Highlight the whole table, and choose Insert > Table. Choose the “2D Stacked Bar” chart type
- Change the x-axis scale by right-clicking and entering the minimum and maximum values. Choose the values so that you can see the “Duration” bar between the Start and End Date bars. Note that Excel uses date values that start at zero at January 1, 1900.
- Reverse the order of the bars so that the earliest is on top. Do this by right-clicking on the vertical (y) axis and choosing “Categories in Reverse Order.”
- Right-click on any other location to choose formatting, such as bar colors, background colors, font styles, and so on.

You can add tasks just by adding them to the table. You can edit the dates of each task and the gantt chart will update in real time. You can also change colors, fonts, bar sizes, and anything else just by right-clicking and formatting it. And on top of that, you can resize and print it just like any other Excel chart!
Gantt Chart Template
You can download the above [download id=”8455″] and easily edit task names and dates to customize to your project. The instructions are:
- Download the Excel file
- Edit the task names in the spreadsheet
- Add any new tasks by choosing Insert > Rows
- Change formatting – fonts, sizes, colors, backgrounds, etc.
- Resize and print the gantt chart
History of Gantt Charts
The Gantt chart gets its name from Henry Gantt, an american engineer who published the charts around the time of 1910 – 1915. Although there are other documented instances of similar charts in the years prior, Gantt charts became popular, and were considered a revolutionary project management technique, during those years, particularly during World War I.
The first Gantt charts were drawn on paper by hand. Obviously, a new chart had to be drawn every time there were schedule changes.
During the 1980’s, the advent of computers allowed for project management software which could allow for rapid changes to the project schedule. Microsoft Project was released in 1984 and rapidly became very popular among project managers.
During the 1990’s, specialty software was developed which lessened the dominance of MS Project, for example Primavera for the construction industry, and MineRP for the mining industry.
The internet age brought on a new suite of online, web based gantt charting software products, which are in heavy use today by the IT industry. However, MS Project and specialty software products remain dominant in their respective industries.
Conclusion
A project manager without a Gantt chart is like a carpenter without a hammer. Anyone who wants to produce successful projects must be familiar with their most important tool, which for the project manager is the Gantt chart. And now, the underlying fundamentals covered in this article give you the foundation you need to build your project management skills higher, further, and faster than you ever thought possible.
Good luck in your project management endeavors!