Carpenters have hammers, plumbers have wrenches, and programmers have computers. But does a project manager have any tools which help them perform their work better, quicker, or cheaper?
Absolutely!
In fact, if you don’t use these tools you will be at a serious disadvantage to other project managers. And if you do, your career will see an order of magnitude return on investment. Don’t believe me?
The following are 20 indispensible tools found inside the toolbox of the project manager.
- Project management software
- The project team
- Leadership skills
- PMBOK Guide
- Managing Successful Projects With PRINCE2
- Gantt chart
- Work breakdown structure
- Critical Path
- PERT Chart
- Project management plan
- Project schedule
- Project budget
- Project scope statement
- Quality standards
- Stakeholder communications plan
- Risk register
- Resource management plan
- Earned value management
- Project status report
- Project final report
Project Management Software
Although the software is more of tool “kit” than one individual project management tool, it gives the project manager a central place to organize their projects. In the past, Microsoft Project was a standard in many industries, but today it is being replaced by web based project management solutions, like Nebulome. In fact, Microsoft has discontinued support for MS Project, however in our engineering business we continue to see widespread use throughout the construction industry.
Many industries have industry-specific software that is very prominent as well, such as Primavera P6 in the construction industry or Promine in the mining industry.
The Project Team
 A project manager’s most powerful weapon is the project team. They perform the project’s technical work. They ensure it is performed on time, on budget, and to the highest quality standards. A good project team ensures a successful project and makes the project manager look good in the process, but they have needs too. They need to be given good working conditions, work-life balance, and future career prospects. In short, they need to be treated like people.
Take care of the project team, and they will take care of you.
Leadership Skills
There is nothing more powerful than a project manager who realizes the analytical as well as the creative side of their job. Projects, by definition, achieve a one-time business goal that is unique versus regular operational, maintenance activities. This requires leading people to a new place, which requires leadership skills. Project managers must be visionaries who provide a big picture viewpoint of the end product or result. Where are we going? How will we get there? What are we going to accomplish?
PMBOK Guide
 But the management side of the equation usually comes first, which is where the Project Management Body of Knowledge (PMBOK Guide) comes in. It contains 5 process groups and 10 knowledge areas. The process groups are chronological (roughly) project phases and the knowledge areas are used whenever the expertise is required.
The PMBOK Guide makes sure your project schedule, budget, scope, stakeholder communications and procurement are adequately taken care of, so you can focus on the leadership side.
Managing Successful Projects with PRINCE2
 The PRINCE2 project management methodology is very common in the UK and growing in the rest of the world. It is not a comprehensive project management knowledge base like the PMBOK Guide, hence it does not contain concepts like earned value management, the critical path method, or schedule development. Rather it is a system of project organization. A PRINCE2 project must fulfill the roles and responsibilities set out in the manual (project manager, executive, team leader, etc.) and each party is required to maintain certain project documents with well defined contents. Thus, it holds each party accountable for their portion of the project.
Although they are not strictly equivalent, it is advisable to use either PRINCE2 or the PMBOK Guide, not both.
Gantt Chart
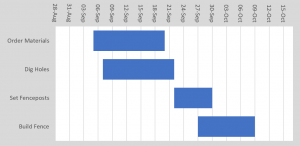 A gantt chart is like a hammer to a carpenter – It’s the project manager’s most used day-to-day tool. It’s the first thing the project manager looks at in the morning every day. The gantt chart is a graphical depiction of the project schedule using horizontal bars to illustrate each task’s start and end dates. It provides the fastest way to see the project schedule, but it’s missing a key component.
The resources assigned to the task are not readily visible in the chart. What if the excavator doesn’t finish it’s previous project commitment on time and isn’t available? What if the database is not populated in time? What if the programmer’s wife has a baby and the application isn’t completed on time?
The gantt chart must always be viewed in light of resource availability, or it risks becoming nothing more than a nice, colorful picture.
Work Breakdown Structure
The power of professional project management (PMBOK Guide or PRINCE2) rests on a foundation called a Work Breakdown Structure (WBS).
But don’t be intimidated by the fancy words. It simply means division of the project into constituent tasks, like this:
| ID | Task |
|---|---|
| 100 | Dig holes |
| 200 | Build fence |
Every task gets managed on its own, including budget, schedule, resources, and so forth.
Project control also happens on a task by task basis, which means that each task is continually assessed for conformance to budget and schedule (or any other success criteria).
Managing projects using a WBS is effortless, and it’s amazing how quickly project managers move on to bigger projects when they have this foundation in place.
The Critical Path
The critical path is a group of tasks which define the completion date of the project. If a task on the critical path is late, the overall project completion date is late by the same amount. Hence, the project manager should know what tasks are on the critical path and give them extra priority.
Tasks that have low float are close to being on the critical path, hence they should be monitored accordingly.
Although the gantt chart can show the critical path via a different color or style of bars, you cannot determine which tasks are on it without a network diagram. Good project management software will calculate it for you.
PERT Chart
 The Program Evaluation and Review Technique (PERT) was the precursor to modern project management. A PERT chart is an Activity-on-Arrow diagram of the project tasks.
Today, network diagrams are used to communicate project tasks to stakeholders. Network diagrams are usually Activity-on-Node which is more intuitive, but can be Activity-on-Arrow as well. The terminology “PERT Chart” lives on, however.
Project Management Plan
Professional project management sets itself apart with a seeming obsession with planning. Because projects are unique and seek to achieve a one-time business goal, there is usually a significant amount of forward moving, “stepping out” required. Hence, a solid plan is indispensable to project success.
The project management plan contains the project budget, schedule, scope statement, stakeholder communication plans, resource management plans, and any other planning aspect. In terms of the project setup, there are three things which tend to form the core project structure:
- Budget
- Schedule
- Resources
If we take the work breakdown structure and add the three components, we get a solid project plan.
| ID | Task | Budget | Schedule | Resources |
|---|---|---|---|---|
| 100 | Dig holes | $1,000 | July 1 – 10 | Bob, Shovel |
| 200 | Build fence | $4,000 | July 5 – 15 | Bob, Bill, Fenceposts, Fence material |
Project Schedule
 The project schedule is one of the project manager’s top tools. Since projects are by definition temporary, that is, with a defined beginning and end, meeting the project deadline is one the project manager’s most critical roles.
Developing a bulletproof project schedule that can stand the test of the usual multitude of project issues requires a strong bout of common sense mixed with practical know-how. Task durations are estimated using three methods:
- Expert judgment is the best estimating tool. Subject matter experts are not always available but if not, all efforts should be made to find them. Their knowledge ensures that the project plan will be realistic and achievable, putting the project on a firm foundation from the start.
- Analogous estimating involves using the actual duration from previous projects to estimate the new project. For example, the parking lot paving project took 5 days at the previous site, therefore this one should take 7 days.
- Parametric estimating uses known unit rates that are averaged over many projects. For example, since we average 100 m2 per day of paving, therefore this paving should take 7 days.
These estimates are done on a task by task basis and rolled up into an overall project estimate, a process called bottom up estimating. The project is then estimated top down, by performing the above estimating methods on the overall project and apportioning them throughout each task. Finally, from the top down and bottom up approaches an overall estimate is chosen.
Project Budget
The project budget is one of the most scrutinized tools of the project manager. It is estimated on a task by task basis using the same tools as the schedule (above) and rolled up into an overall project budget.
There is one additional technique that is often used in budgeting, called three point estimating. In this method, each task is assigned three values:
- The Most Likely (ML) estimate is the regular estimated value.
- An optimistic (O) estimate
- A pessimistic (P) estimate
The final task estimate can be derived from either:
- A standard distribution (average):
Estimate = (O + ML + P) / 3
- A beta distribution
Estimate = (O + 4ML + P) / 6
This method is more intuitive since most people can readily identify the optimistic and pessimistic values for a given task. If the odds of landing on one side of the estimate are better than the other, this skew is accounted for because it raises or lowers the estimate accordingly. The standard distribution (average) is the default, and the beta distribution can be used when you want to tighten the estimate to the Most Likely value.
Project Scope Statement
Projects have very distinct boundaries. Every task performed or expenditure made is either part of the project or not part of it. If these boundaries are not clear or explicitly defined, things tend to end up within the project that weren’t estimated during the planning phase, thereby quietly driving up the schedule and budget in a process called scope creep.
Hence, a strong project scope statement defines the project boundaries. Like the fence building project in our example, it builds the fence around the project and is one of the biggest tools against scope creep.
Quality Standards
Many projects have finished on time and budget only to realize that the deliverables are of insufficient quality. Thus, quality standards are a major tool within the project manager’s toolbox and should not be left to assumption.
During the planning phase, the project manager must choose the quality standards which apply to the project deliverables. Often there are internal written standards which can be utilized, but if not there are standards organizations whose business is to produce quality standards for you. Unless your project is extremely innovative, such as a mission to Mars, one of these organizations will have a written quality standard that will make sure everyone on the project team knows what’s expected of them:
- The International Standards Organization (ISO)
- Country-specific standards organizations, like the American National Standards Institute (ANSI), Bureau of Indian Standards (BIS), etc.
- Industry-specific standards organizations, like the American Society for Testing and Materials (ASTM)
Stakeholder Communications Plan
 Stakeholders are the “people” part of a project. They include the executive branch and project sponsor above the project manager, and the project team below the project manager. They also include external stakeholders like government regulatory agencies or surrounding landowners. Sometimes the end user of the product is different from the owner organization, such as in software development projects, making them a stakeholder as well.
Many projects have performed excellent work but failed to adequately communicate with stakeholders. If the stakeholders are not satisfied, the project is not a success. But the opposite is not true. If the stakeholders are happy in spite of a below average project performance, the project might still be considered a success (although not recommended as a project management strategy). Such is the importance of stakeholder satisfaction.
Because of the importance of stakeholders, stakeholder communications planning must be one of the top tools in the project manager’s toolbox.
Risk Register
Large megaprojects meticulously track their risks, for example Olympic venues traditionally spend 15 – 20% of their budget on developing contingency plans for unexpected events. Small projects, on the other hand, almost never devote any time to risk management. But why not? If large projects do it, you would think it would have a correspondingly smaller value for small projects too.
The PMBOK Guide specifies the creation of a risk register, which tracks the most important risks. Risk has two components:
If the probability and/or severity (or both) are high enough, contingency plans should be in place. The risk register is the tool which allows proper risk management.
Resource Management Plan
Resources represent the biggest day to day use of the project manager’s time. What people are working on, when they will be done, what tools and equipment they need, and when the materials will arrive are typical day to day decisions made by the project manager. Schedules are usually created without large contingencies for unexpected resource hiccups, hence an issue with any one of the project resources can trip up the project.
That’s why you need a resource management plan. It contains the following items:
- Resource calendars specify when the resource is available. They can range from simple calendars showing the project team’s holidays to project management software that integrates with the project schedule.
- Resource leveling is a scheduling technique that involves extending the schedule to smoothen out the project resources. Schedules are usually not developed with resource availability in mind, creating spikes and dips in resource usage. For example, your project schedule includes a few overlapping tasks which result in Bob being required 12 hours one day and 2 hours the next, therefore you might need to pay him overtime, putting the project over budget. It would be advantageous to extend the schedule to avoid the overtime (if possible) – this is resource leveling, and it should occur regularly throughout the project.
Earned Value Management
Project control is the process of determining if the project is performing according to the project management plan (budget, schedule, scope, etc.) and taking appropriate action if it is not. The PMBOK Guide specifies a method called earned value management, which has become standard in the project management profession. It works like this:
- Each task is inspected and assigned a percent complete.
- Three variables are determined from the project:
- Planned Value (PV) is the planned project progress expressed as a task budget. For example, if it’s July 10, and a task has a schedule of July 5 – 15, and a budget of $4,000, PV = $4,000/2 = $2,000.
- Earned Value (EV) is the actual progress expressed as a task budget. For example, if the above task is 25% complete, EV = 25% x $4,000 = $1,000.
- Actual Cost (AC) is the cost of the task to date, tracked from software or time/receipts.
- Four variables determine the current project status
- Schedule Variance (SV) is the amount that the task is ahead or behind schedule.
- Schedule Performance Index (SPI) is the percentage (relative) that the task is ahead or behind schedule.
- Cost Variance (CV) is the amount that the task is over or under budget.
- Cost Performance Index (CPI) is the percentage (relative) that the task is over or under budget
- Four variables determine where the project is headed
- Estimate at Completion (EAC) is the anticipated final project budget if past project performance continues.
- Estimate to Complete (ETC) is the amount of money necessary to finish the project.
- Variance at Completion (VAC) is the projected final Cost Variance (CV) of the project.
- To Complete Performance Index (TCPI) is the Cost Performance Index (CPI), in other words the efficiency, required to make the project finish on its original budget.
The earned value metrics provide a rapid assessment of the project’s health, and they are current right up to the point of analysis (usually today).
Project Status Report
Executives and other stakeholders need to know the project’s status regularly.
Project status reports can range from a monthly email to complex reports for large projects. But even small projects can utilize a small report that contains the most basic earned value metrics and a comment of project status, for example:
- The Cost Variance (CV)
- The Schedule Variance (SV)
- Progress this week – comment
- Tasks for next week – comment
The project status report is a highly visible tool which can pay great dividends if used consistently.
Project Final Report
Project closure is one of the most underrated phases of project management. It takes very little time and effort yet possesses a disproportionately large amount of visibility to the executive and upper management. Included in the final reporting is the following items:
- Final budget
- Final completion date and interim milestone dates
- Project summary, including lessons learned and analysis of success/failure relative to the project business case
- Itemization of project costs (for future estimating purposes)
- Contract closure
- As-built details
- Transition information (for example, operations and maintenance documentation and knowledge transfer)

