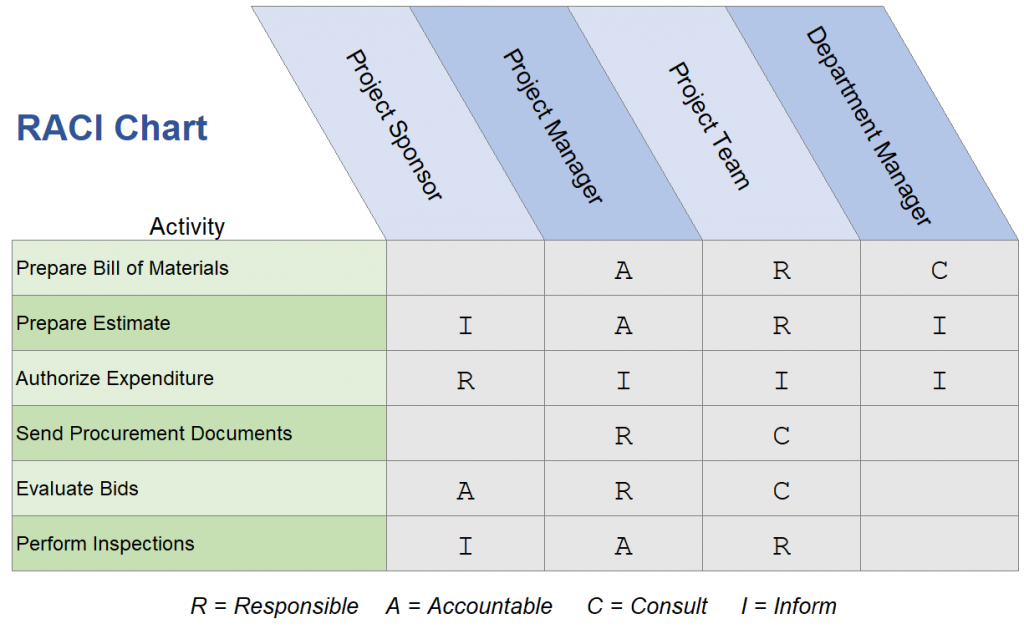
A RACI Chart (pronounced “racy”) is a visual representation of the responsibilities of a project. RACI stands for Responsible – Accountable – Consulted – Informed.
It is an excellent way to communicate what the responsibilities of each member of the project team are. In a RACI chart, each project task is assigned to each project member within the project organizational chart according to one of four responsibility levels.
The left side contains a listing of the project tasks and milestones, and the top contains the project members. Each task as mapped to everyone involved in the project through the four responsibility levels:
- Responsible (R)
- Accountable (A)
- Consulted (C)
- Informed (I)
Example RACI Chart
The four responsibility levels are:
- Responsible (R)
This task falls within the project member’s primary area of responsibility. It’s their job! The task falls within their expertise and day-to-day responsibilities. They must also ensure that the task finishes on time and the quality level of the deliverables are satisfactory. This is usually the project team who performs the technical work. Project managers usually have administrative and project management tasks that fall within their job description, and project sponsors usually must approve the project’s expenditures.This group perform the tasks in collaboration with the people who are accountable (A) for them. - Accountable (A)
This group of people are held accountable for the results of the task even though they are not directly performing the work. They are accountable for the timely execution of the task, the quality of the deliverables, and any other success criteria. They often get credit for the success or failure of the task and their job performance depends on it. This includes people who are reviewing or approving the deliverables. They must be familiar with the technical details of the work because it will reflect on them. - Consulted (C)
This group needs to be consulted. That is, they wish to provide input into the task. They possess knowledge or resources that need to be incorporated into the task’s work and deliverables. This group must be consulted with in a reasonable time frame and according to their schedules and priorities. - Informed (I)
This group wants to know the results of the task. They have no other stake in the project other than to receive the deliverables, or even simply to be informed of the results.
Rules for RACI Charts
Although the chart is open to whatever strategies cause the project to succeed, there are a few general rules of thumb:
- Every row must have at least one R (responsible) person. If there is no R on the row, there is nobody assigned to do the work.
- Every row must have at least one A (accountable) person. For small projects this is often the same person, and the box can be labeled R/A. I can also be persuaded that there are rare situations where there is no accountable person for a task within a project, but in those situations it is likely that another person should be included within the RACI chart (for example, board member, executive, etc.) who fills the accountability gap.
- The number of R’s (responsible) per row should be minimized. For small projects it should be limited to only one if possible. Any more means that several people are working on the same task on the same level. For large projects this is okay, but for small projects listing some of the members in the A (accountable) category is often more effective from a management point of view.
Responsibility Assignment Matrix (RAM)
The term Responsibility Assignment Matrix (RAM) is often used in textbooks and university courses. The RAM and RACI chart are the same thing.
How to Create a RACI Chart
RACI charts are very simple and fast to create using MS Excel. They should take no more than 10 minutes. The steps are:
- Open MS Excel
- List the project tasks (work breakdown structure) on the left column
- List the project members within the project organizational chart along the top row
- Enter the letters R, A, C, and I as desired into the middle boxes
What is a RACI Chart Used For?
RACI charts show the project resources assigned to each work package. They illustrate the connections between tasks and project members. RACI charts are an extremely fast and efficient way to communicate the project’s roles and responsibility assignments for all of the project members.
They are usually, although not always, developed by the project manager to ensure that all parties know what is expected of them.
All of us have stories about a project sponsor who was unengaged with the project, or an engineer that delayed a project by letting a technical review sit on their desk for weeks, or a stakeholder that withheld their acceptance of the project because they were not kept informed.
These types of scenarios can be easily avoided by keeping an updated a RACI chart.


