
The definition of genius is taking the complex and making it simple.
– Albert Einstein
I have good news for you. If you are in the manufacturing business, you can become a genius today, right now.
The shop floor can be a complex maze of raw materials moving in interlocking production lines, stations with varying cycle times, supply needs, and manpower requirements, and customers who need their orders at a specific time. How do you make sure you can deliver high quality product on time, over and over again?
You need to take the complex and make it simple.
What is a Value Stream?
In lean manufacturing, the value stream is the sequence of steps that result in value. What is value?
- Value is monetary or material worth. Something that someone is willing to pay for.
Therefore, the value stream represents the sequence of actions that are required in order to receive a payment from someone, from initial order through to final delivery. In some cases the value stream could represent a non-monetary item (for example, in a research and development project) but in this case the project benefits must be well defined.
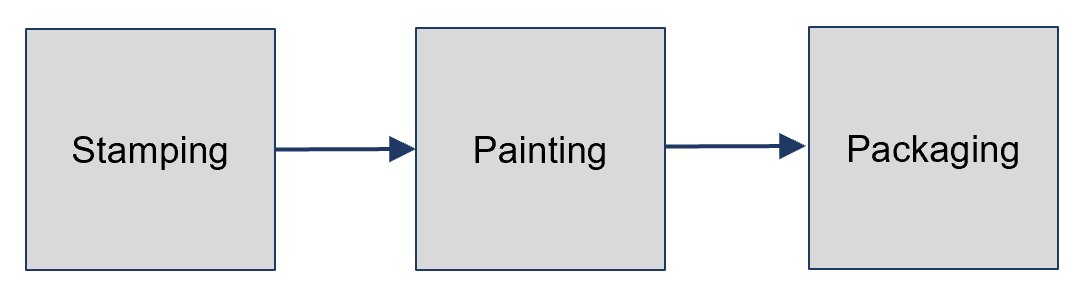
For example, a simple value stream indicates the processes necessary to produce the product and deliver it to a customer:
 In a project setting, the value stream is the project tasks:
| ID | Task Name |
|---|---|
| 100 | Removal |
| 200 | Strengthening |
| 300 | Reinstallation |
This is also called a Work Breakdown Structure (WBS), although the Project Management Body of Knowledge (PMBOK Guide) differentiates between the WBS and the task (activity) list, we will keep it simple here. A project and a manufacturing system are quite similar in that they produce a product for someone, the main difference being that a manufacturing system produces many products (or even indefinitely), whereas a project often produces only one, or only a few, products.
To visualize the value stream, complex industrial processes are turned into a simple value stream map. This document has standard formats and symbols.
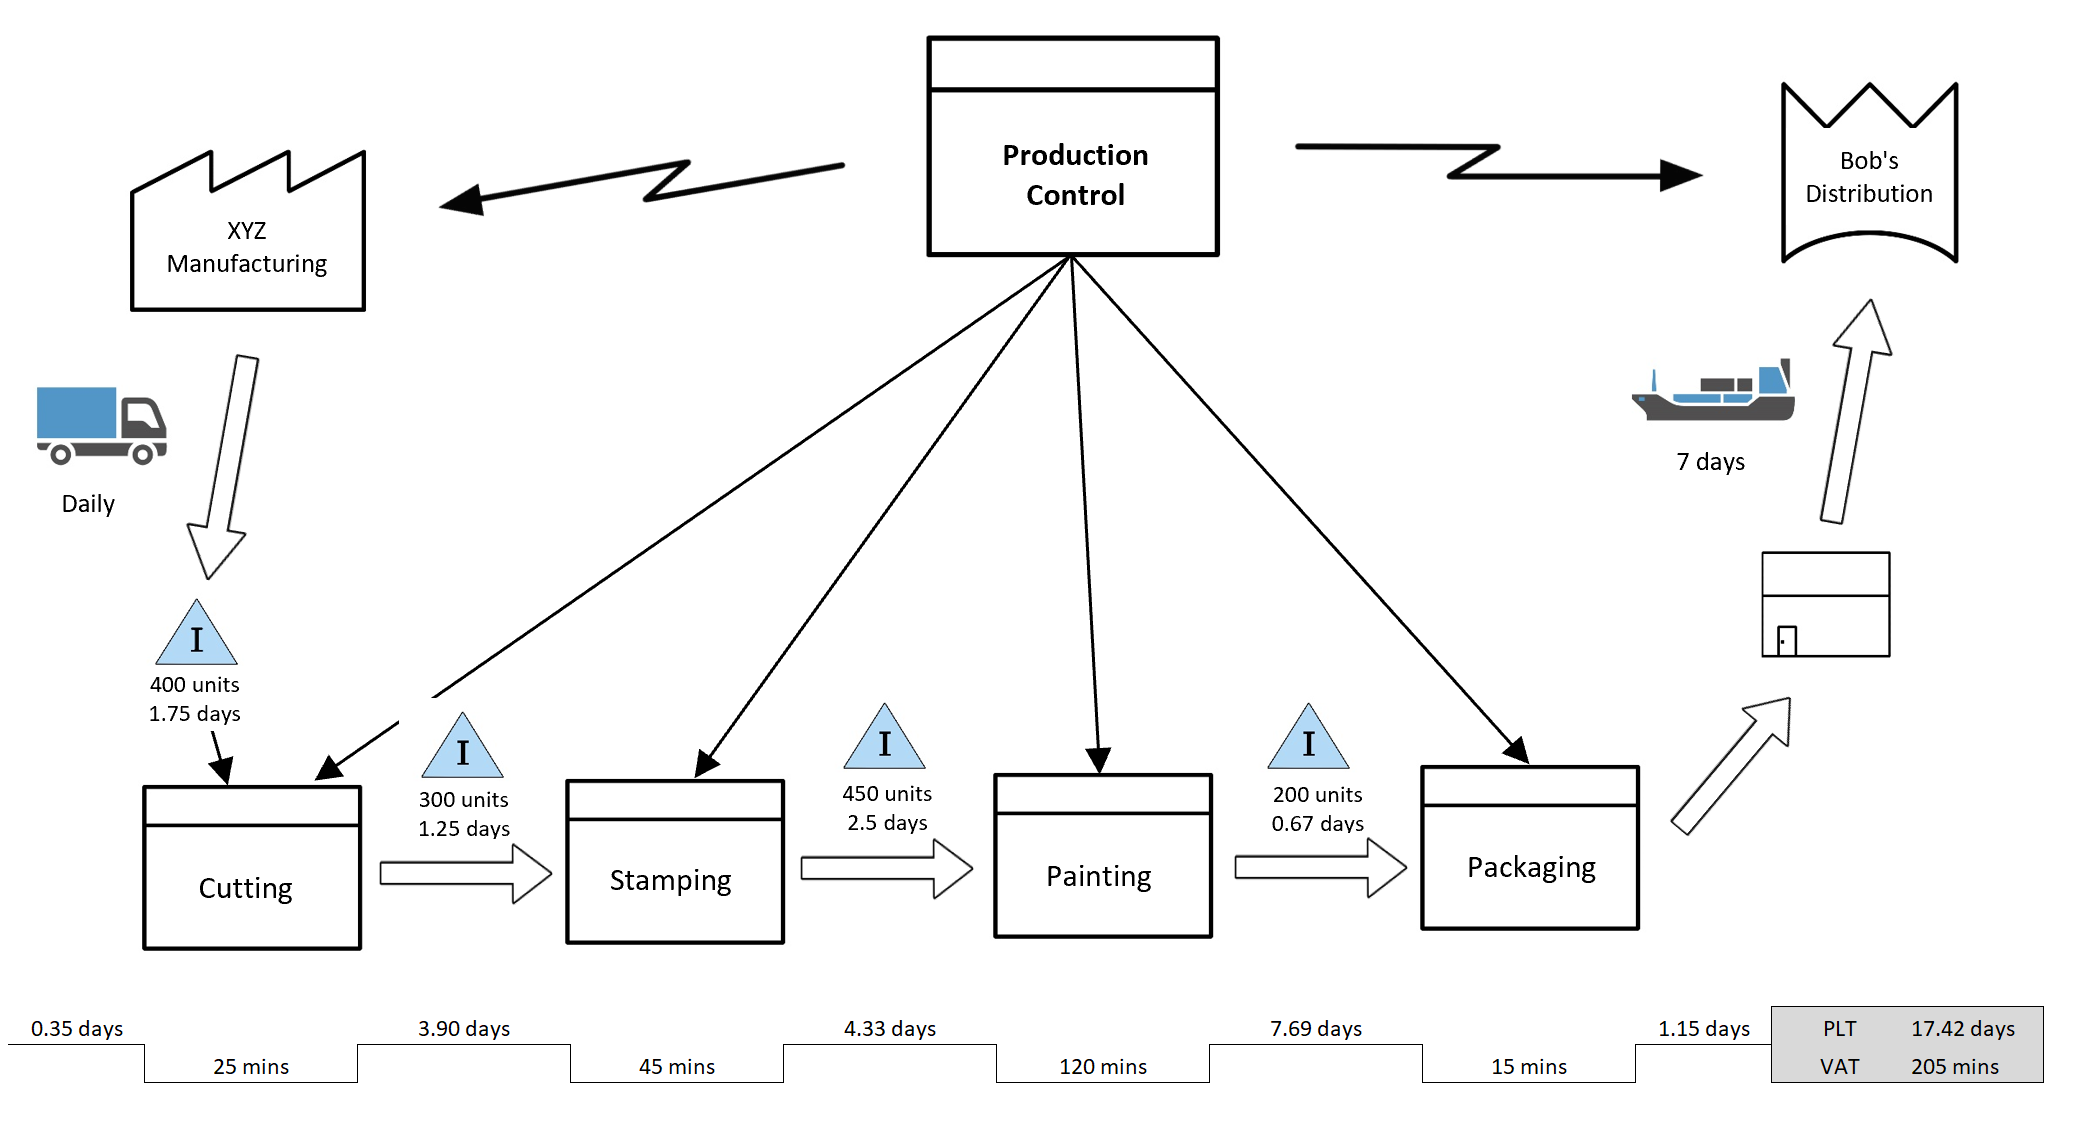
Although it may look complicated, the basic production tasks of Cutting – Stamping – Painting – Packaging is the core of the chart. Smart people always add more complexity to these types of charts, but if you understand the production steps across the bottom you have most of the wisdom you need. You are a genius by association.
Although value stream mapping originated in the manufacturing industry, it is applicable to almost any sector in any industry. Indeed, the concept of determining value and then eliminating waste from that value stream is central to the competitiveness of any business, anywhere.
Steps to Create a Value Stream Map
More good news. You don’t have to be a genius to perform the 5 steps in the creation of a value stream map:
- Identify Value
Value is defined as something that someone is willing to pay for. Although it is usually quite clear what the value proposition is (a widget, project report, constructed building, etc.) there are often many requirements that define the quality or grade of the product. How many features, how quickly can it be delivered, how strong is it, how long does it last, what does it cost to operate? The list of project requirements is usually long. - Identify the processing steps required to create the value
The main processing steps are determined and mapped, in the order of processing. Each process is given a square box. For example,- Cutting
- Stamping
- Painting
- Determine the inventory movement requirements
In between each processing step is a requirement to move the inventory to the next step. This can occur via an automated conveyor (the quickest method) but often other requirements must be present, such as equipment (forklifts), human interaction (carrying), or transportation from one plant to another. Each process is given an icon to show what the transportation method is:- Ground freight (truck)
- Air freight (airplane)
- Train freight
- Boat shipment
- Ground freight (truck)
- Determine the processing time of each step
Since the goal of value stream mapping is to shorten the total time from raw material to finished good, the processing time for each inventory step, the processing time of each step should be itemized. This is called the takt time in lean manufacturing-speak. Normally they are shown underneath each task, on a separate row at the bottom of the chart. For example, if a group of wires takes 2 minutes to solder onto the circuit board, the processing time of this step is 2 minutes. - Determine the lead time between steps
The amount of time that a piece of inventory spends between steps is the other major part of the inventory processing time. Hence, the amount of time that each inventory item must spend in storage between processing steps is analyzed and calculated. This depends on the speed at which each station processes units and the amount of buffer designed into the system.

Value Stream Mapping Calculations
 The part which makes you look smart, the bottom of the value stream map contains two calculations, each of which is assigned its own row. The calculations are performed for each process in the production chain. The calculations are:
- Production lead time is the time that inventory is required to be stored prior to processing. For example, if the widget is stored for 5 hours prior to painting, the production lead time of 5 hours is shown underneath the painting process.
- Processing time is the amount of time inventory spends within each process. Although relatively easy to determine, the processing time must include all phases of the station, including:
- Machine setup time
- Machine operation time
- Worker processing time
The sum of each is shown at the far right side of the value stream map. This represents the total time that each unit of inventory spends within the plant.
In lean manufacturing, the goal is to limit the amount of time that inventory spends waiting. That means that as soon as a piece of raw material enters the first production station it should proceed all the way through to finished good, without stopping. Every production station is designed so that it requires the same amount of time to perform its work, called the takt time.
This is an ideal goal. In the real world, however, each process has variation. In other words, a process does not take exactly the same amount of time every time it is performed, which leads to inventory queuing requirements between stations. Nonetheless, the goal of perfect “flow” allows for the continuous and ongoing elimination of waste that does not contribute to the production of value, an activity called kaizen.
To fully assure your brilliance, use the value stream map as a basis for process improvement projects that inspect one production station and improve it by:
- Reducing defects
- Performing jidoka
- Reducing variation
Value Stream Mapping Symbols
Value stream maps use standard methodology and symbols to communicate the creation of value creating activities. A few of the main symbols are:
| Symbol | Name | Description |
|---|---|---|
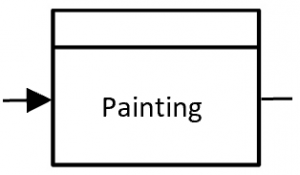
| Process | Indicates one processing station within the plant. The process is labeled at the top of the box. The small box in the bottom right indicates the use of a software system. | |
| External plant or supplier | Indicates an outside supplier, or service. The name of the supplier is labelled within the icon, for example, XYZ Manufacturing. | |
| Warehouse | A storage location for inventory along the value stream which is removed and processed (or shipped) later. | |
| Inventory queue | A location where inventory is queued between processing steps. This icon is normally used between each process. The number of inventory units being stored at that location should be shown underneath the icon. | |
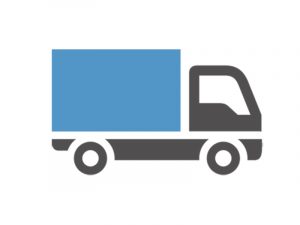
| Truck shipment | Indicates that the inventory is transported with a truck from one process to the next. The frequency of shipments should be shown underneath the symbol, for example, “daily.” | |
| Operator | Indicates that an operator is required. This symbol is normally used inside the process box to signify that a human operator is required at the processing station. | |
| Inbox | Indicates where a physical order backlog exists |
These are the main symbols used in the creation of value stream maps, but the comprehensive list of standard symbols can result in a highly communicative value stream map.