Earned Value Management is the secret to project success! If you are passionate about having projects finish on time, on schedule, and with all other project success criteria satisfied, you must learn how to use it.
Earned Value Management is a project control technique used by project managers to keep projects on schedule and budget.
Earned Value analysis gives the project manager a snapshot of the project status from two points of view:
- Budget
- Schedule
It also gives you a forecast of these two variables at project completion, assuming that future project performance is the same as past performance.
The earned value calculation can take place at any time, but generally it is performed at weekly intervals, or at some other predefined project status points. However, before this can be done there are a few things that need to be planned into the project.
Project Planning
At the beginning of the project, the project manager must do four things:
- Divide the project into tasks.
All of the project scheduling and control tasks are built on the foundation of project tasks. The earned value metrics are calculated for each task and summed to determine the overall project status. - Assign each task a start and end date.
Project scheduling is a discipline unto itself, but for small projects the start and end dates can be chosen based on experience or actual past project data. This baseline project schedule is used to compare against the actual project status calculated with the earned value method. - Assign each task a budget.
Just like with the schedule, a budget for each task is necessary for the definition of the project. This will be used to compare against the actual project budget values. - Choose a project status period.
The earned value calculations need to be performed at regularly defined intervals to be useful. A weekly status period works great for almost every project, big or small, but whatever status period you choose, pick it wisely and stick to it.
Here is what an example task might look like after project planning:
| ID | Name | Start | End | Budget |
|---|---|---|---|---|
| 100 | Set up Database | Mar. 1 | Mar. 10 | $10,000 |
The Earned Value Calculation
Performing the earned value calculation at each predefined status points is a 5 step process.
- Gather Work Performance Information
- Determine Schedule Status
- Determine Cost Status
- Forecasting
- Reporting
I will now walk you through each step.
Gather Work Performance Information
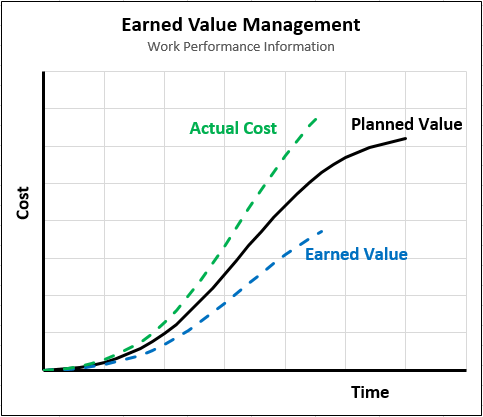 To start, the project manager gathers four pieces of information for each task:
- Budget at Completion (BAC)
- Planned Value (PV)
- Earned Value (EV)
- Actual Cost (AC)
These are the inputs to the earned value management system.
Budget at Completion (BAC)
The Budget at Completion (BAC) refers to the budget of each task. This is determined during project planning therefore it is already available, but it is used in the project status and forecasting calculations detailed below.
In our above example, this step is very simple. We will rename the budget column ‘BAC’:
| ID | Name | Start | End | BAC |
|---|---|---|---|---|
| 100 | Set up Database | Mar. 1 | Mar. 10 | $10,000 |
Planned Value (PV)
Also called the Budgeted Cost of Work Scheduled (BCWS), the PV is the authorized, time-phased budget assigned to accomplish the work. It is the amount that the project is supposed to be complete up to that status point.
Let’s say it’s March 3 today. The planned percent complete is 30% based on the start and end dates. Therefore,
PV = 30% x $10,000 = $3,000.
| ID | Name | Start | End | BAC | PV |
|---|---|---|---|---|---|
| 100 | Set up Database | Mar. 1 | Mar. 10 | $10,000 | $3,000 |
Earned Value (EV)
Also called the Budget Cost of Work Performed (BCWP), the EV is the measure of the work performed at a specific point in time, expressed in terms of the approved budget authorized for that work. It is the amount that the project is actually complete up to that status point.
Let’s say that after discussions with the applicable project team members and inspection of the progress, we determine that the task is actually 20% complete.
EV = 20% x $10,000 = $2,000.
We will add another column to our table.
| ID | Name | Start | End | BAC | PV | EV |
|---|---|---|---|---|---|---|
| 100 | Set up Database | Mar. 1 | Mar. 10 | $10,000 | $3,000 | $2,000 |
Actual Cost (AC)
Also called the Actual Cost of Work Performed (ACWP), the AC is the realized cost for the work performed during a specific time period. It is the actual cost of the work up to that status point.
Let’s say that after reviewing our time and expense software and compiling any miscellaneous expenses, we determine that the actual cost of the task is $4,500.
We will once again add a another column to the table.
| ID | Name | Start | End | BAC | PV | EV | AC |
|---|---|---|---|---|---|---|---|
| 100 | Set up Database | Mar. 1 | Mar. 10 | $10,000 | $3,000 | $2,000 | $4,500 |
This is the end of the information gathering phase. Now we will determine the schedule and cost status of the project.
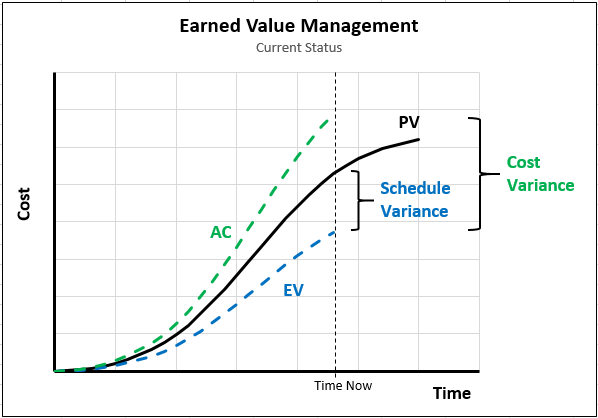
Determine Schedule Status
It’s time to answer the question:
- How far ahead or behind schedule is the project?
To do this, we will calculate two variables from the initial four we gathered from the project data, above:
- Schedule Variance (SV)
- Schedule Performance Index (SPI)
Schedule Variance (SV)
The schedule variance, usually abbreviated SV, tells you how far ahead or behind schedule the task is in terms of the task budget. It is expressed in terms of the task budget, not the actual hours or days ahead or behind schedule. The SV must be calculated for each task and summed to determine the overall project SV.
The formula is:
- If SV is negative, the task is behind schedule.
- If SV is zero, the task is on schedule
- If SV is positive, the task is ahead of schedule.
For example,
- SV = -$500 means the project is behind schedule.
- SV = $0 means the project is right on schedule.
- SV = $500 means the project is ahead of schedule.
With the schedule variance, positive is good.
You can compare the size of the schedule variance to the task’s budget. For example, if the above schedule variance of $500 is for a task with a budget of $1,000, the task is significantly behind. But for a task value of $100,000 this is not nearly as concerning.
We will add a column to the table for Schedule Variance.
SV = $2,000 – $3,000 = -$1,000.
| ID | Name | Start | End | BAC | PV | EV | AC | SV |
|---|---|---|---|---|---|---|---|---|
| 100 | Set up Database | Mar. 1 | Mar. 10 | $10,000 | $3,000 | $2,000 | $4,500 | -$1,000 |
This task has a schedule variance of -$1,000 on a task value of $10,000, therefore it is 10% behind schedule. It should probably be flagged for action by the project manager, or at least an explanation determined.
Schedule Performance Index (SPI)
The Schedule Performance Index, normally abbreviated SPI, is similar to the Schedule Variance (SV). It also tells you how far ahead or behind schedule the task is in terms of the task budget, but it is a relative measure rather than an absolute one. The formula is:
- If SPI is less than 1, the task is behind schedule.
- If SPI is one, the task is on schedule
- If SPI is greater than 1, the task is ahead of schedule.
For example,
- SPI = 0 means the project work has not started.
- SPI = 0.5 means the project has performed half the work it was supposed to at this point.
- SPI = 1.0 means the project is on schedule.
- SPI = 2.0 means the project has performed twice the work it was supposed to at this point.
With the SPI, greater than 1.0 is good.
We will add a column to the table for SPI.
SPI = $2,000 / $3,000 = 0.67.
| ID | Name | Start | End | BAC | PV | EV | AC | SV | SPI |
|---|---|---|---|---|---|---|---|---|---|
| 100 | Set up Database | Mar. 1 | Mar. 10 | $10,000 | $3,000 | $2,000 | $4,500 | -$1,000 | 0.67 |
It is easy to see that the example task has accomplished only two thirds of what it should have at this point.
Determine Cost Status
 Once the schedule status is determined it’s time to figure out where the project stands in terms of budget. We seek to answer the following question.
- How far over or under budget is the project?
To do this we will calculate two more variables from the initial four we gathered from the project data. They are very similar to the schedule-related variables but require their own interpretation and understanding.
- Cost Variance (CV)
- Cost Performance Index (CPI)
Cost Variance (CV)
The Cost Variance, usually abbreviated CV, is the amount that the task is over or under its budget. It must be calculated for each task and summed to produce the overall project’s cost variance. The formula is:
- If CV is negative, the task is over budget.
- If CV is zero, the task is on budget.
- If CV is positive, the task is under budget.
For example,
- CV = -$1,000 means the project is over budget.
- CV = $0 means the project is right on budget.
- CV = $1,000 means the project is under budget.
In the case of both CV and SV, positive is good.
The CV can be compared to the task’s budget, for example if the above cost variance of $1,000 applied to a task with a budget of $2,000 it has incurred an overrun equal to 50% of the task, a seemingly existential problem, whereas if the task budget was $100,000 the overrun is small and could probably be mitigated somewhere else.
We will add a column to the table for CV.
CV = $2,000 – $4,500 = -$2,500.
| ID | Name | Start | End | BAC | PV | EV | AC | SV | SPI | CV |
|---|---|---|---|---|---|---|---|---|---|---|
| 100 | Set up Database | Mar. 1 | Mar. 10 | $10,000 | $3,000 | $2,000 | $4,500 | -$1,000 | 0.67 | -$2,500 |
The task is $2,500 over budget on a task value of $10,000. If everything goes according to plan from here on, the task will finish at $12,500. There is clearly a budget problem as well as a schedule one.
Cost Performance Index (CPI)
The Cost Performance Index, usually abbreviated CPI, like the Cost Variance, is a measure of the cost performance of the project, but it is a relative instead of an absolute measure. The formula is:
- If CPI is less than 1, the task is over budget.
- If CPI is one, the task is on budget.
- If CPI is greater than 1, the task is under budget.
For example,
- CPI = 0 means the project work has not started.
- CPI = 0.5 means the project has spent twice amount that it should have at this point.
- CPI = 1.0 means the project is on schedule.
- CPI = 2.0 means the project has spent half the amount that it should have at this point.
In the case of both CPI and SPI, greater than 1.0 is good.
We will add a column to the table for CPI.
CPI = $2,000 / $4,500 = 0.44.
| ID | Name | Start | End | BAC | PV | EV | AC | SV | SPI | CV | CPI |
|---|---|---|---|---|---|---|---|---|---|---|---|
| 100 | Set up Database | Mar. 1 | Mar. 10 | $10,000 | $3,000 | $2,000 | $4,500 | -$1,000 | 0.67 | -$2,500 | 0.44 |
The task has spent more than twice what it should have at this point.
In short, this task has a minor schedule problem and a major cost problem. A quick glance at the table, where SPI = 0.67 and CPI = 0.44 indicates that this task is in danger of extending the project’s completion date or driving the project over budget. Neither of those have occurred yet, but 3 days into our 10 day task the project manager can clearly see that action needs to be taken.
The four variables we just calculated (SV, SPI, CV, and CPI) tell you the current schedule and budget status (the current snapshot). But naturally we want to know what the project is on track for at completion. Can we extrapolate those values to see what the project would look like when it’s complete? That’s where the forecasting metrics come in.
Forecasting
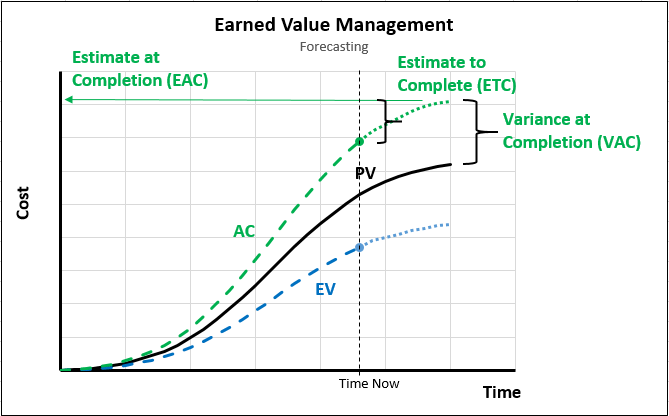 There are four variables which allow the project manager to forecast the future performance of the project:
- Estimate to Complete (ETC)
- Estimate at Completion (EAC)
- Variance at Completion (VAC)
- To Complete Performance Index (TCPI)
Estimate to Complete (ETC)
ETC represents the expected cost required to complete the project. It measures only the future budget needed to complete the project, not the entire budget (that’s the EAC, next). It allows the project manager to compare the funding needs to finish the project with funding available.
The ETC can be calculated either for each task or for the whole project. There are two ways to calculate ETC:
- Based on past project performance:
ETC = (BAC – EV) / CPI
Since each of the input variables (right side of the equation) has been determined prior to this step, the ETC can be calculated either for each task or directly for the whole project.
- Based on a new estimate
This is called a Management ETC. This means that a new estimate of the remaining tasks in the project is performed.
In our example task we will calculate the ETC based on the past performance of the project. Again, we will add a column to the table for ETC.
ETC = ($10,000 – $2,000) / 0.44 = $18,182.
| ID | Name | Start | End | BAC | PV | EV | AC | SV | SPI | CV | CPI | ETC |
|---|---|---|---|---|---|---|---|---|---|---|---|---|
| 100 | Set up Database | Mar. 1 | Mar. 10 | $10,000 | $3,000 | $2,000 | $4,500 | -$1,000 | 0.67 | -$2,500 | 0.44 | $18,182 |
This task is worth $10,000 and has already spent $4,500. Don’t worry, be happy, right? Wrong. Based on its past performance it will need another $18,182 to complete.
Of course there are often unique, one-time circumstances which caused this problem or situations which alter the future performance of the project. In these cases a Management ETC (i.e new estimate) is necessary, which is entered into the ETC column. There is nothing wrong with this practice.
Estimate at Completion (EAC)
The EAC is the full task or project cost expected at completion (the new project budget). It can be calculated on a task by task basis or once for the entire project.
There are multiple ways to calculate it based on how you expect the future of the performance of the project to be:
- Future performance will be based on the budgeted cost
If you think the existing variance was a unique, one-time event and the rest of the project should go according to plan, simply add the remaining project budget to the actual cost incurred to date (AC). This method does not assume the project finishes on budget. Rather it takes into account the one time event and adjusts the whole project plan upward or downward to determine the final result.EAC = AC + (BAC – EV) - Future cost performance will be based on past cost performance
If you think the past performance is not unusual and there is no reason to expect the project to perform any differently than it already has, you would use this formula.EAC = AC + [(BAC – EV) / CPI] - Future cost performance will be influenced by past schedule performance
Since schedule and cost performance are usually related, there could be a reason to adjust the cost performance by the schedule performance. In this case an average of the CPI and SPI are used to extrapolate the final project cost.EAC = AC + [(BAC -EV) / (CPI x SPI)]You could also use a combination of the past schedule or cost performance to extrapolate the final project cost. You could use only the schedule performance (SPI). Or you could figure in a small influence of the schedule performance. In the formula below, 20% of the SPI and 80% of the CPI has been used to determine the final project cost.
EAC = AC + [(BAC -EV) / (0.8·CPI x 0.2·SPI)] - A new estimate is produced
In this case a Management ETC can be added to the to-date cost (AC) to determine the final EAC.EAC = AC + ETC
The first two forecasting methods represent the extremes, and the third represents an attempt to forecast somewhere in between those extremes. Finally, the fourth method represents a new estimate if the other methods are not able to produce the desired result.
For example, if the project is currently over budget, the worst case scenario would have you forecasting using the current trajectory. The best case scenario would have you using the originally planned trajectory, starting from today’s date. If you feel you need to be somewhere in between, you can use a combination of the schedule and cost performance (SPI and CPI), and if none of those alternatives give you the desired result you will need to produce a new estimate.
In our example we will predict that the current problems were caused by a one time event that isn’t likely to repeat itself. Thus, the EAC will use formula #1.
EAC = AC + (BAC – EV) = $4,500 + ($10,000 – $2,000) = $12,500.
The table now looks like this:
| ID | Name | Start | End | BAC | PV | EV | AC | SV | SPI | CV | CPI | ETC | EAC |
|---|---|---|---|---|---|---|---|---|---|---|---|---|---|
| 100 | Set up Database | Mar. 1 | Mar. 10 | $10,000 | $3,000 | $2,000 | $4,500 | -$1,000 | 0.67 | -$2,500 | 0.44 | $18,182 | $12,500 |
One can quickly see that the task, which was supposed to cost $10,000 (BAC), is now projected to cost $12,500 (EAC).
Variance at Completion (VAC)
The VAC is a forecast of what the variance, specifically the Cost Variance (CV), will be upon the completion of the project. It is the size of the expected cost overrun or underrun. In many situations the project manager must request additional funding as early as possible, or at least report the potential for an overrun. The VAC represents the size of this request.
The formula is:
= Old Budget – New Budget
If you’ve calculated the EAC you’ve done the big math already, and the ‘new budget’ can simply be subtracted from the ‘old budget’ to determine the cost overrun or underrun.
The Variance at Completion is simply a future projected Cost Variance. It has the same units as CV. It is the same type of element.
We will once again add another column to the table:
| ID | Name | Start | End | BAC | PV | EV | AC | SV | SPI | CV | CPI | ETC | EAC | VAC |
|---|---|---|---|---|---|---|---|---|---|---|---|---|---|---|
| 100 | Set up Database | Mar. 1 | Mar. 10 | $10,000 | $3,000 | $2,000 | $4,500 | -$1,000 | 0.67 | -$2,500 | 0.44 | $18,182 | $12,500 | -$2,500 |
To Complete Performance Index (TCPI)
The TCPI represents the efficiency level, specifically the CPI, that will make the project finish on time. It can be a powerful indicator because it is generally easy to ascertain if your people will be as productive as the indicator tells you. This indicator tends to be a bigger red flag than other indicators. If it tells you, for example, that your people need to be twice as efficient as the schedule, it tends to make you take notice that action needs to be taken.
There are two ways to calculate the TCPI:
- To achieve the original budget
If the goal is to achieve the original project budget, that is, the overrun or underrun has not resulted in a change to the project schedule and/or budget, the following formula applies:TCPI = (BAC – EV) / (BAC – AC) - To achieve the revised budget
If the goal is to achieve the project’s EAC, that is, the budget has been revised and an approved change to the project schedule/budget has occurred, use this formula. If additional funds covering the cost overrun have been requested and approved by the project sponsor, the EAC becomes the target of the project, and this scenario applies.TCPI = (BAC – EV) / (EAC – AC)
Obviously, the closer the project is to completion the higher the CPI that will be necessary to complete on budget. It can become extreme near the end.
Also, if the project has already spent more than its budget the TCPI will be negative.
TCPI is the last column in the table. We will assume the project budget has not been revised (EAC is simply a projection) and the goal is still the original project budget (formula #1, above).
TCPI = ($10,000 – $2,000) / ($10,000 – $4,500) = 1.45.
| ID | Name | Start | End | BAC | PV | EV | AC | SV | SPI | CV | CPI | ETC | EAC | VAC | TCPI |
|---|---|---|---|---|---|---|---|---|---|---|---|---|---|---|---|
| 100 | Set up Database | Mar. 1 | Mar. 10 | $10,000 | $3,000 | $2,000 | $4,500 | -$1,000 | 0.67 | -$2,500 | 0.44 | $18,182 | $12,500 | -$2,500 | 1.45 |
This project team must be 45% more efficient than they have been to finish on budget. A seemingly difficult task.
Reporting
The earned value management system is very easy to report to senior management or other stakeholders. Generally the recipient needs some basic training regarding the meaning of the numbers, but this is not a major undertaking. A simple definition list with each metric would normally suffice.
Small Projects
For small projects that last about 3 weeks or less, a simple earned value table that includes the cost and schedule variances could meet the reporting requirements:
| Project Status Report | |
|---|---|
| Date | March 3 |
| Project Budget | $10,000 |
| Schedule Variance | -$1,000 |
| Cost Variance | -$2,500 |
| Comments | The project is behind due to a one-time purchase of materials |
This could be done daily to weekly and provides management with an excellent indicator of the project’s status. All it takes is assembling the actual cost data and assigning a percent complete to each task, followed by 30 seconds worth of calculations.
Medium Sized Projects
For projects that last between about 3 weeks to 6 months, a status report that indicates efficiency levels and projected completion dates and budgets is more helpful.
| ID | Name | Start | End | BAC | PV | EV | AC | SV | SPI | CV | CPI | ETC | EAC | VAC | TCPI |
|---|---|---|---|---|---|---|---|---|---|---|---|---|---|---|---|
| 100 | Set up Database | Mar. 1 | Mar. 10 | $10,000 | |||||||||||
| 110 | Acquire Server | Mar. 1 | Mar. 2 | $1,500 | |||||||||||
| 120 | Set up Data Structure | Mar. 3 | Mar. 3 | $1,000 | |||||||||||
| 130 | Move Data | Mar. 4 | Mar. 10 | $7,500 | |||||||||||
| 200 | Build Application | Mar. 7 | Mar. 20 | $15,000 | |||||||||||
| TOTAL | $35,000 | ||||||||||||||
Notice that the 100-level tasks are summary tasks (phases) and the 110-level tasks are the individual project activities. You could also report the metrics by phase, at the 100-level only.
Senior management generally favor the forecast values (ETC, EAC, VAC, and TCPI) whereas stakeholders favor the current project status (SV, SPI, CV, and CPI).
That’s it! You’re now on your way to earned value management on your projects and nailing every project deadline and budget. Please let me know in the comments how it worked for you and share with us the benefits you’ve found.