
How do large corporations make the decision to proceed with a project? What data or metrics do they consider prior to investing billions into a new plant, a new high rise condo, or major I.T. project?
Capital budgeting refers to the financial modelling that evaluates the feasibility and compares potential project investments.
At the end of the day, organizations have a bit of money left over (hopefully!), called profit. They have the option of either investing this back into their current business or carrying out expansion projects, called capital expenditures. Often there are multiple projects to choose from.
Usually, but not always, the investment occurs at the beginning and generates an ongoing return, like this:
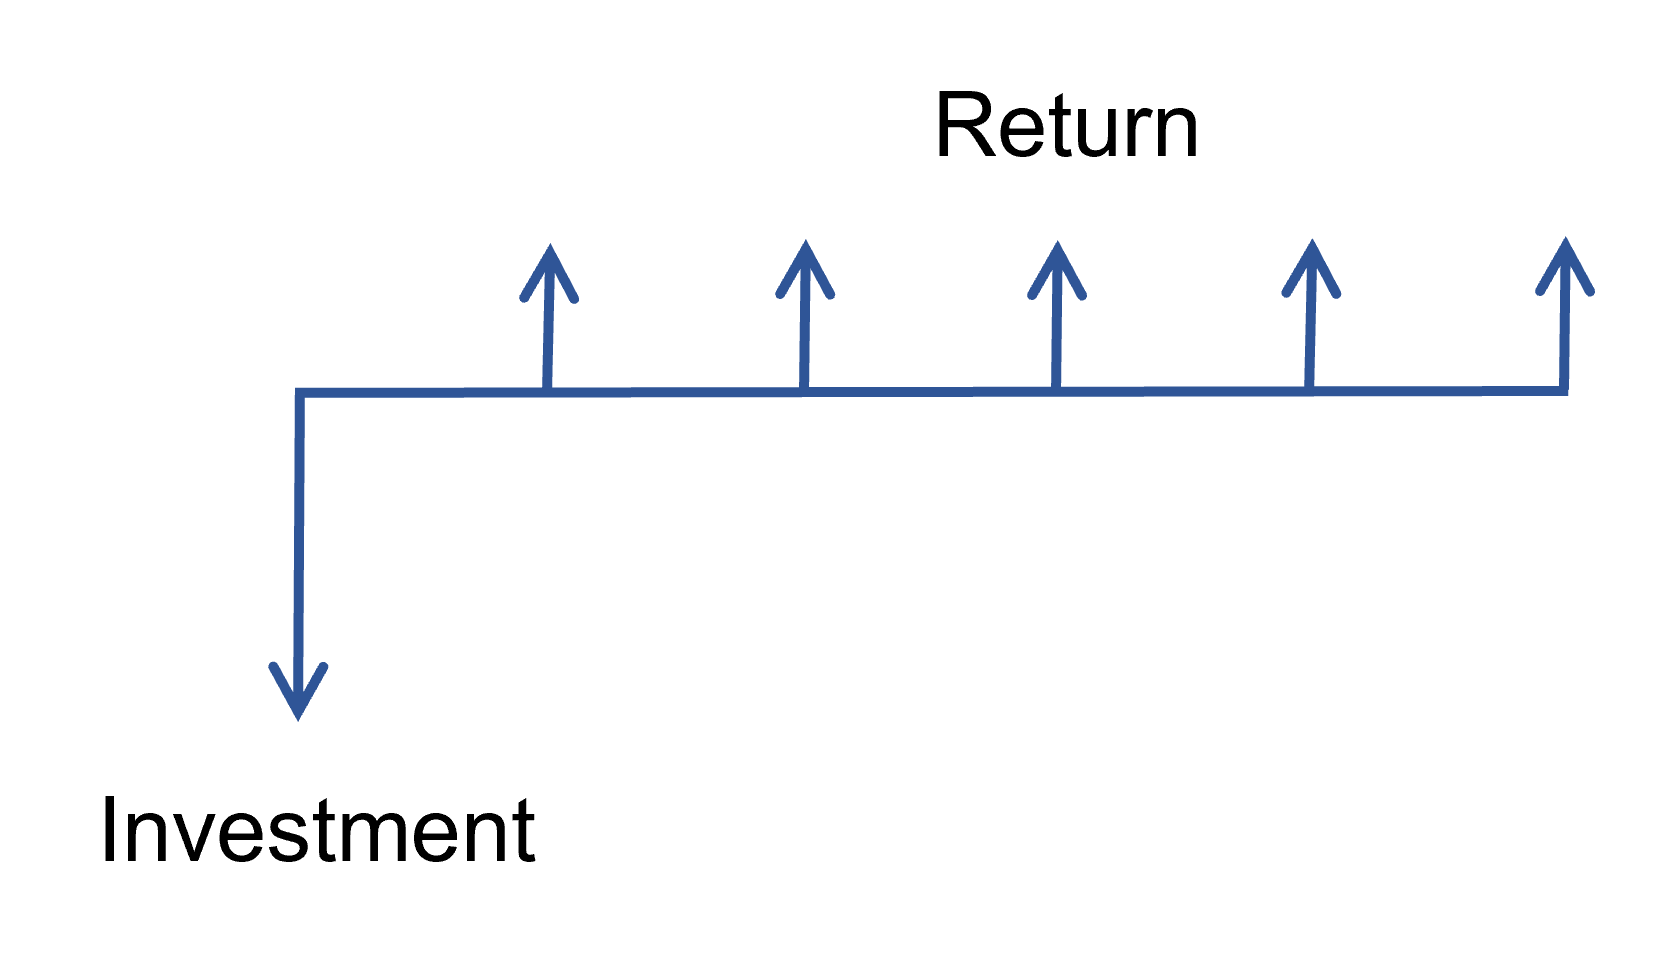
If the return is of an intangible nature, such as for an environmental project, road construction, or the like, a cost benefit analysis is more appropriate.
Capital budgeting methods seek to assess the return on investment of the various alternatives with the goal of making a decision to proceed with one or more projects. The 3 main capital budgeting methods are:
- Net present value
- Internal rate of return
- Payback Period
Net Present Value (NPV)
 The net present value represents the value, in today’s currency, of all of the inflows and outflows generated by the project.
Every project represents a series of cash inflows and outflows. Due to the time value of money, an apples to apples comparison must be made between money received today and money received later. To make an investment decision, each future inflow/outflow is converted to today’s value using a discount rate.
The discount rate is more than the cost of inflation. It represents the opportunity cost, that is, the amount that the project must generate to compete with other projects that the organization could undertake. Even if there is only one project being considered, as a minimum the organization can borrow money and invest it back into the business at a fairly well known rate of return (the current business growth rate). New projects have to compete with that.
- A receipt of $100 today is worth the same – it is not discounted
- A receipt of $100 in one year is discounted by the discount rate. Assuming the discount rate is 5%:
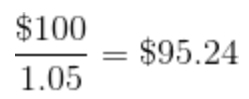
If a salesman proposes to pay your business $100 in one year’s time, it is equivalent to paying you $95.24 today. This is because your business is likely to turn that $95.24 into $100 within that time, throughout the normal course of business and taking into account monetary inflation. - A receipt of any one item of cash flow (CF) in any year is discounted by the formula:

- The whole stream of cash flows representing a project investment is discounted to the present one at a time:

- A payment is represented as a negative, for example, -$100, and treated in the same way.


If the net present value is positive (above zero) the project should be approved. If it is negative, the project should be rejected.
If multiple projects are being considered, the one with the highest NPV should be chosen.
Internal Rate of Return (IRR)
 The internal rate of return measures the rate of return the investment in the project is achieving. It can be compared to the rate of return of the stock market or other investments.
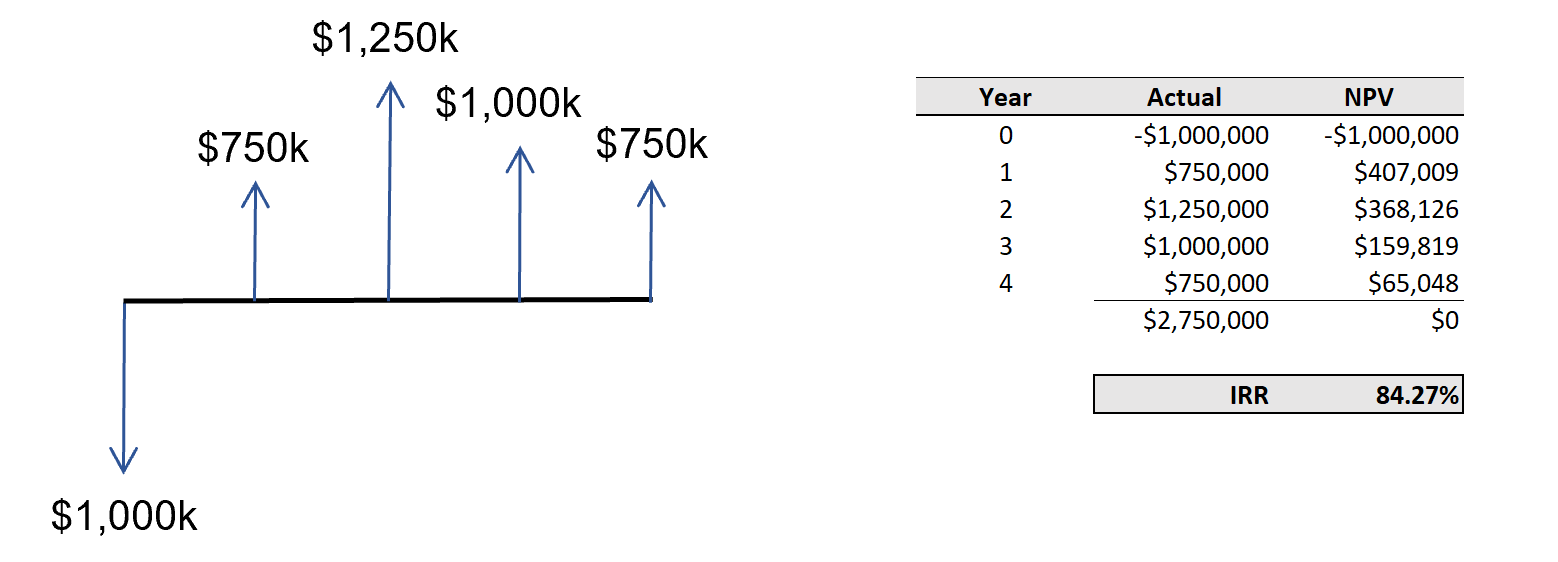
It is the discount rate at which the NPV of the project is zero. It is calculated iteratively, by setting up the NPV calculation in a spreadsheet or other software and changing the discount rate until the NPV equals zero. For example,
Organizations have many places that they can deploy their profits. The excess funds generated from operations can be invested back into their operations, generating a rate of return similar to the previous activities that generated the profits in the first place. Or they could be invested into a capital project, expansion or new venture. Many organizations even have multiple capital projects that compete for the investment. But the return obtained by the funds that are invested into the existing operations is called the cost of capital. New projects must complete with this.
Further complicating matters is that the company can obtain debt financing to carry out the projects. The debt financing comes with a known (usually) interest rate.
Hence, the rate of return being obtained from existing operations is averaged with the interest rate on debt to obtain the weighted average cost of capital (WACC).
This WACC is the target.
- If IRR > WACC, the project should proceed
- If IRR < WACC, the project should be rejected (or revised).
The IRR might still be positive, but when it is less than the WACC the project does not represent an investment that is stronger than the company’s existing operations. Hence there are better places to invest the money.
The main drawback of IRR is that it assumes excess capital is reinvested at the project’s IRR, rather than the corporation’s cost of capital. Since this is unlikely, the IRR might be skewed in the direction of approving the project.
Payback Period
 The payback period represents the amount of time in which the investment recoups its initial capital expenditure. It is the break even point of the investment.
The net present value and internal rate of return are fantastic indicators. They give the project an apples to apples comparison with other investment and project alternatives. But they are missing a critical piece. That is, they don’t take into account how quickly the investment is returned to its investors.
NPV vs. IRR vs. Payback Period
For most projects, the NPV and IRR will generate the same accept/reject decision. However, their differences are in the timing and magnitude of the cash flows. NPV assumes that the cash inflows are reinvested at the cost of capital, whereas IRR assumes reinvestment at the project’s IRR. Hence, NPV tends to be a more conservative approach.

The payback period is a more qualitative indicator which can guide in decision making. Although the NPV and IRR quantify the investment in relation to other investments or projects, the payback period gives you a picture of how quickly the project returns the organization back to it previous financial position.
If you’ve ever been on the decision end of a megaproject, please let us all know about your thought process in the comments. I (we) would love to know what you went through and how you and your fellow decision makers justified the investment. But I’ve been on the engineering end of the process and I can assure you that getting your return on investment quickly is a big deal when handling complex, multidisciplinary megaprojects. Imaginations run wild at the thought of the multitude of risks that can materialize starting on the day an average megaproject is approved.
As a consequence, many decision makers love the payback period and some might even forgo a bit of IRR in order to see the money back in the bank quickly.
Capital Budgeting Example
Your division of the company has been given a budget of $1 million to proceed with expansion projects. The weighted average cost of capital (WACC) for the corporation is 7%. You have determined 3 project options to choose from:
| Project | Capex | IRR | NPV | Payback Period |
|---|---|---|---|---|
| A | $1,000,000 | 35% | $1,450,000 | 2.3 years |
| B | $200,000 | 40% | $320,000 | 3.3 years |
| C | $800,000 | 12% | $845,000 | 4.7 years |
Project A will spend your entire budget. Project’s B and C can both be performed.
All three of the projects are above the WACC hence they will all benefit the company. Project B is clearly the most profitable, however is it the best decision? Projects B and C together would have a lower rate of return than project A, but are still above the WACC.
The answer is that you would choose project A because it utilizes the available funding with the maximum return.