Value stream maps are diagrams used in lean manufacturing which identify each step of the manufacturing process. They are used to determine the value stream, that is, the steps that result in the creation of value.
Their purpose is to visualize the manufacturing process so that anything that is not necessary to create the product of value can be eliminated. This is called muda (japanese for waste), and the goal is absolute elimination. Also, continuous improvement projects (called kaizen) are planned based on the value stream map.
A typical value stream map looks like this:

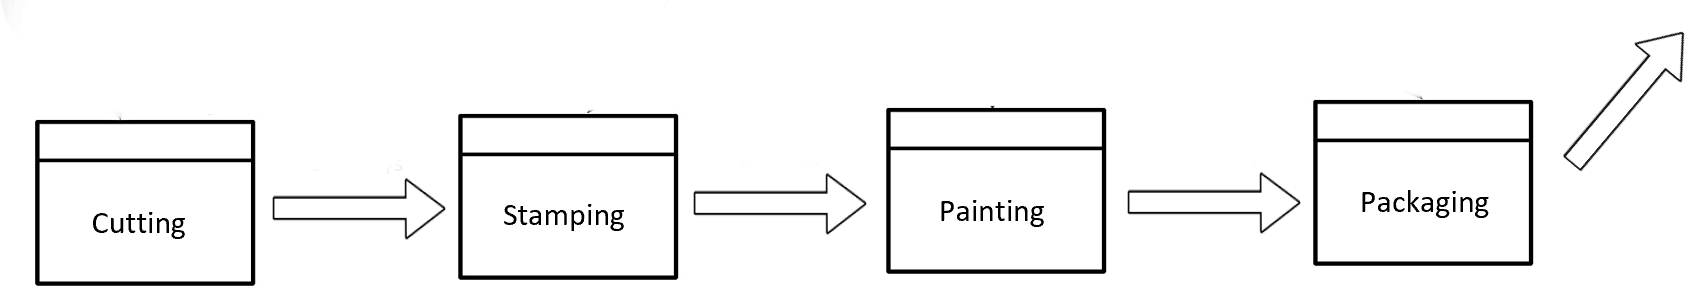
Although it may look complicated, the main value producing steps are the horizontally aligned boxes along the bottom, labelled Cutting-Stamping-Painting-Packaging, and this is the most important part of the value stream map.
There are 8 steps to developing a powerful value stream map:
- Draw Production Control
- Draw the supplier(s)
- Draw the customer(s)
- Draw the processing steps
- Add transport requirements
- Draw the inventory requirements
- Calculate value added time
- Calculate production lead time
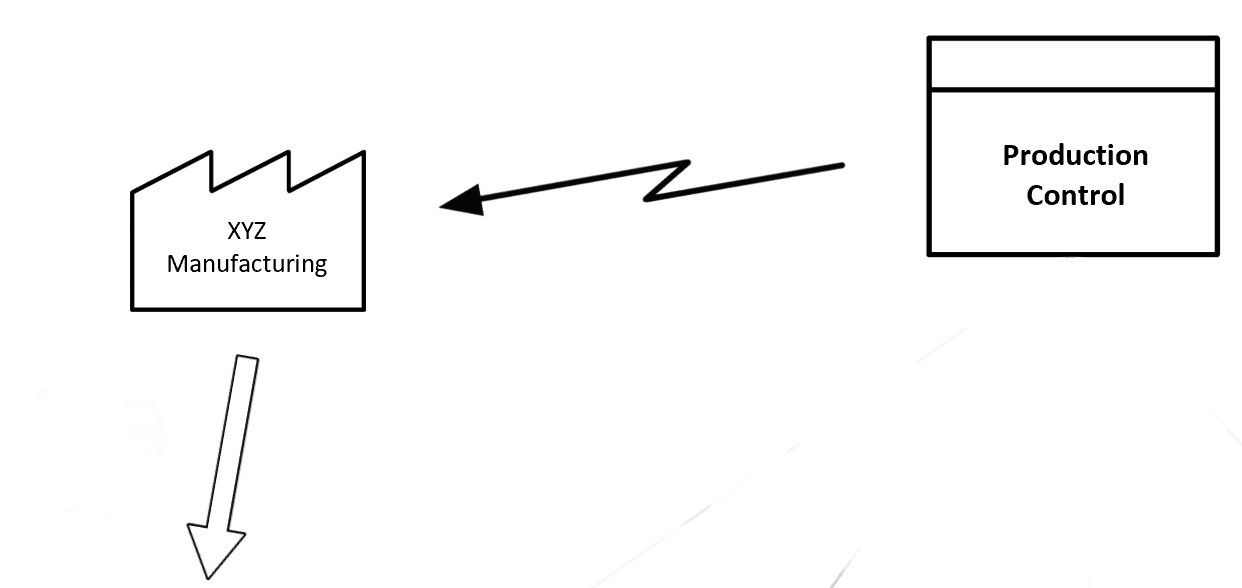
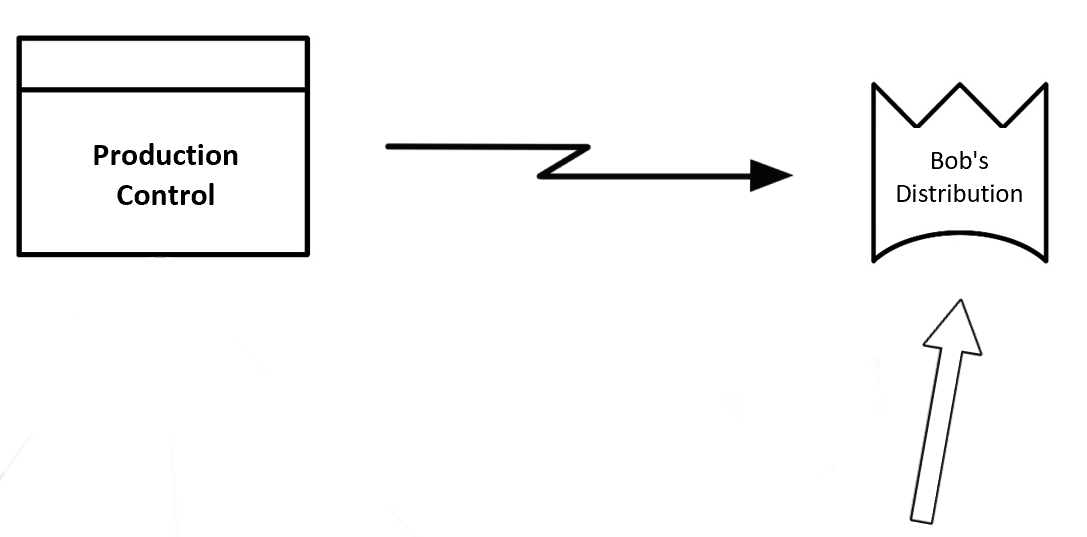
1. Draw Production Control
Production control is the unit which manages the production. It is the “office” above the production floor, and represents the coordination of the production operations that are being described on the value stream map.
The standard place for production control on the value stream map is in the top, middle area. Although it is indicated as a process, it is a special process. Hence, it uses a process icon:![]()
The box in the bottom left is used for software processes such as Manufacturing Resource Planning (MRP) or other management processes.
2. Draw the Supplier(s)
Almost all plants have raw material inputs that are processed into outputs. These inputs arrive at the receiving part of the plant, undergo several rounds of processing, and are then shipped to a customer.
On the value stream map, the inputs into the plant are designated for the top left corner of the chart. This includes all suppliers whose parts arrive and become part of the finished product. Suppliers are designated with an external icon, like this:
![]() Normally the name of the supplier is written inside the symbol, for example, “ABC Manufacturing.” The full supplier side of the chart includes the transport mode and frequency, and inventory requirements, like this:
Normally the name of the supplier is written inside the symbol, for example, “ABC Manufacturing.” The full supplier side of the chart includes the transport mode and frequency, and inventory requirements, like this:
3. Draw the Customer(s)
The finished products that leave the processing plant are shipped to external customers. These are the people or organizations who receives delivery of the products produced by the plant.
The customers are designated for the top right corner of the value stream map. The customers are given their own icon:
![]()
Once again, the name of the receiving organization is written into the symbol, for example, “Bob’s Distribution.” The full value stream map for the customer area includes the storage requirements, shipping method and frequency, and information flow:
4. Draw the Processing Steps
Now for the meat and potatoes of the value stream map. The bottom of the chart is reserved for the processes undertaken by the plant. Each process required to add value is included with the process icon (same as production control) and the name of the process is inserted within it, for example,
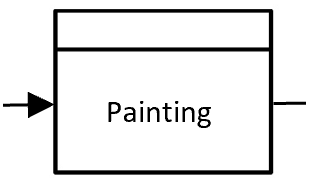 This box represents the production station in which the product is being painted. It does not matter how big, strong, heavy, or important the production station is, only that it is a necessary piece of the chain that creates value.
The bottom portion of the value stream map looks like this:
5. Add Transport Requirements
The transportation of goods throughout the value chain is represented by the mode of transport and the frequency of shipments. For example,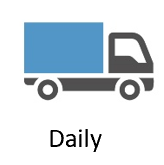 This information should be placed on the value stream map wherever a shipment occurs between physical plants.
6. Draw the Inventory Requirements
Inventory is represented on the value stream map with a triangle encasing the uppercase letter I. Two pieces of information should be written below the symbol:
- Average number of units being stored
- Average time the units spend there
This allows for rapid assessment of plant inventories. For example, to show that 450 units are stored with an average storage time of 2.5 days, we would write: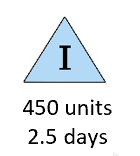 This would be placed at the location on the map where the inventory accumulates.
7. Calculate Value Added Time
Value Added Time (VAT) shows you the amount of time the product spends at each production station, and it is measured from the time the raw materials enter the station to the time that they are finished.
It does not include the time waiting for processing, either before or after.
On the value stream map, a jagged line is placed below each production step, the lower parts for production and the higher parts for inventory. The VAT of each process is placed on the line.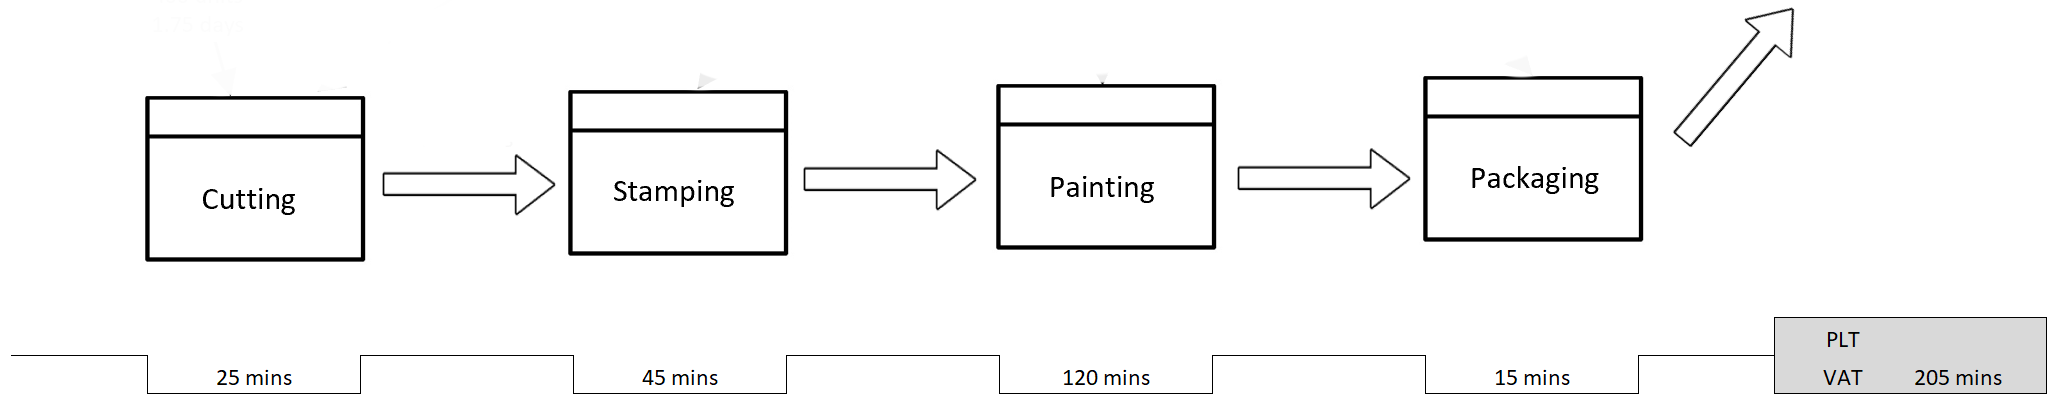 Since the VAT is the time spent “creating value,” the rest of the time spent by the material in the plant is in inventory between processing stations. This is called the “Production Lead Time.”
8. Calculate Production Lead Time
Production Lead Time (PLT) is the time the product spends waiting in inventory between production steps. This can be in a separate storage location or directly at the assembly line between stations.
The PLT is noted on the value stream map on the upper parts of the jagged line. Since the PLT is usually quite high, a portion of a day, week, or month must be noted.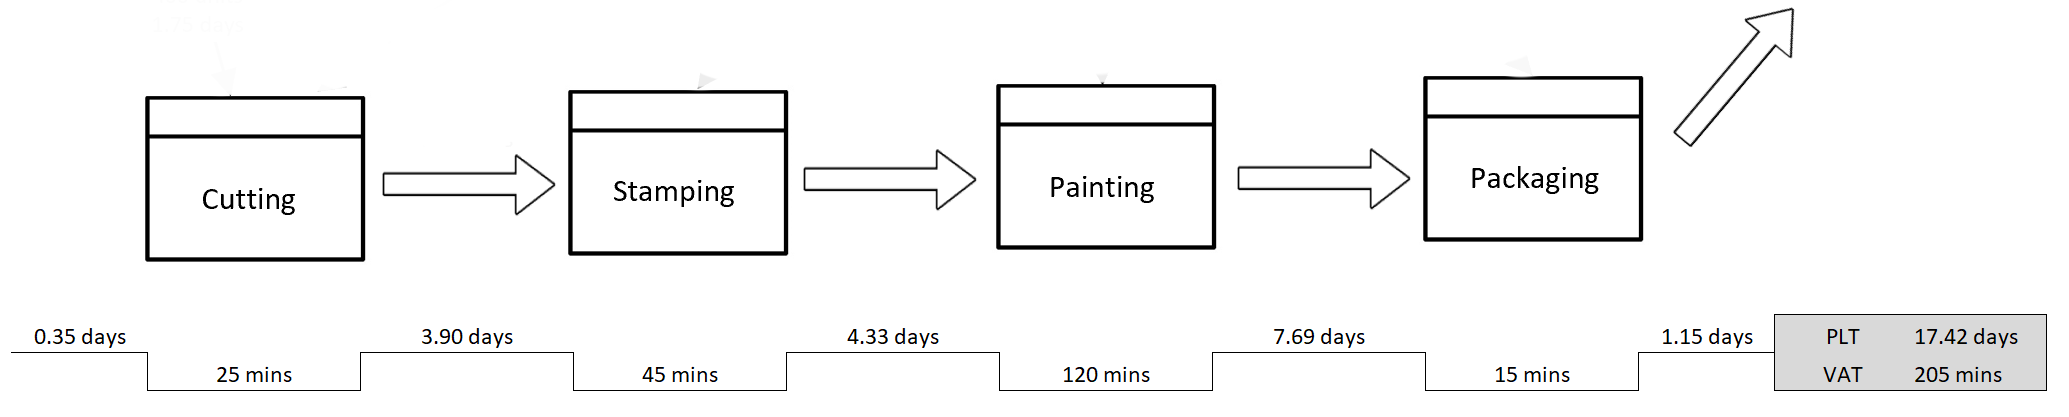
The Value Stream Map
Once again, the final value stream map looks like this:
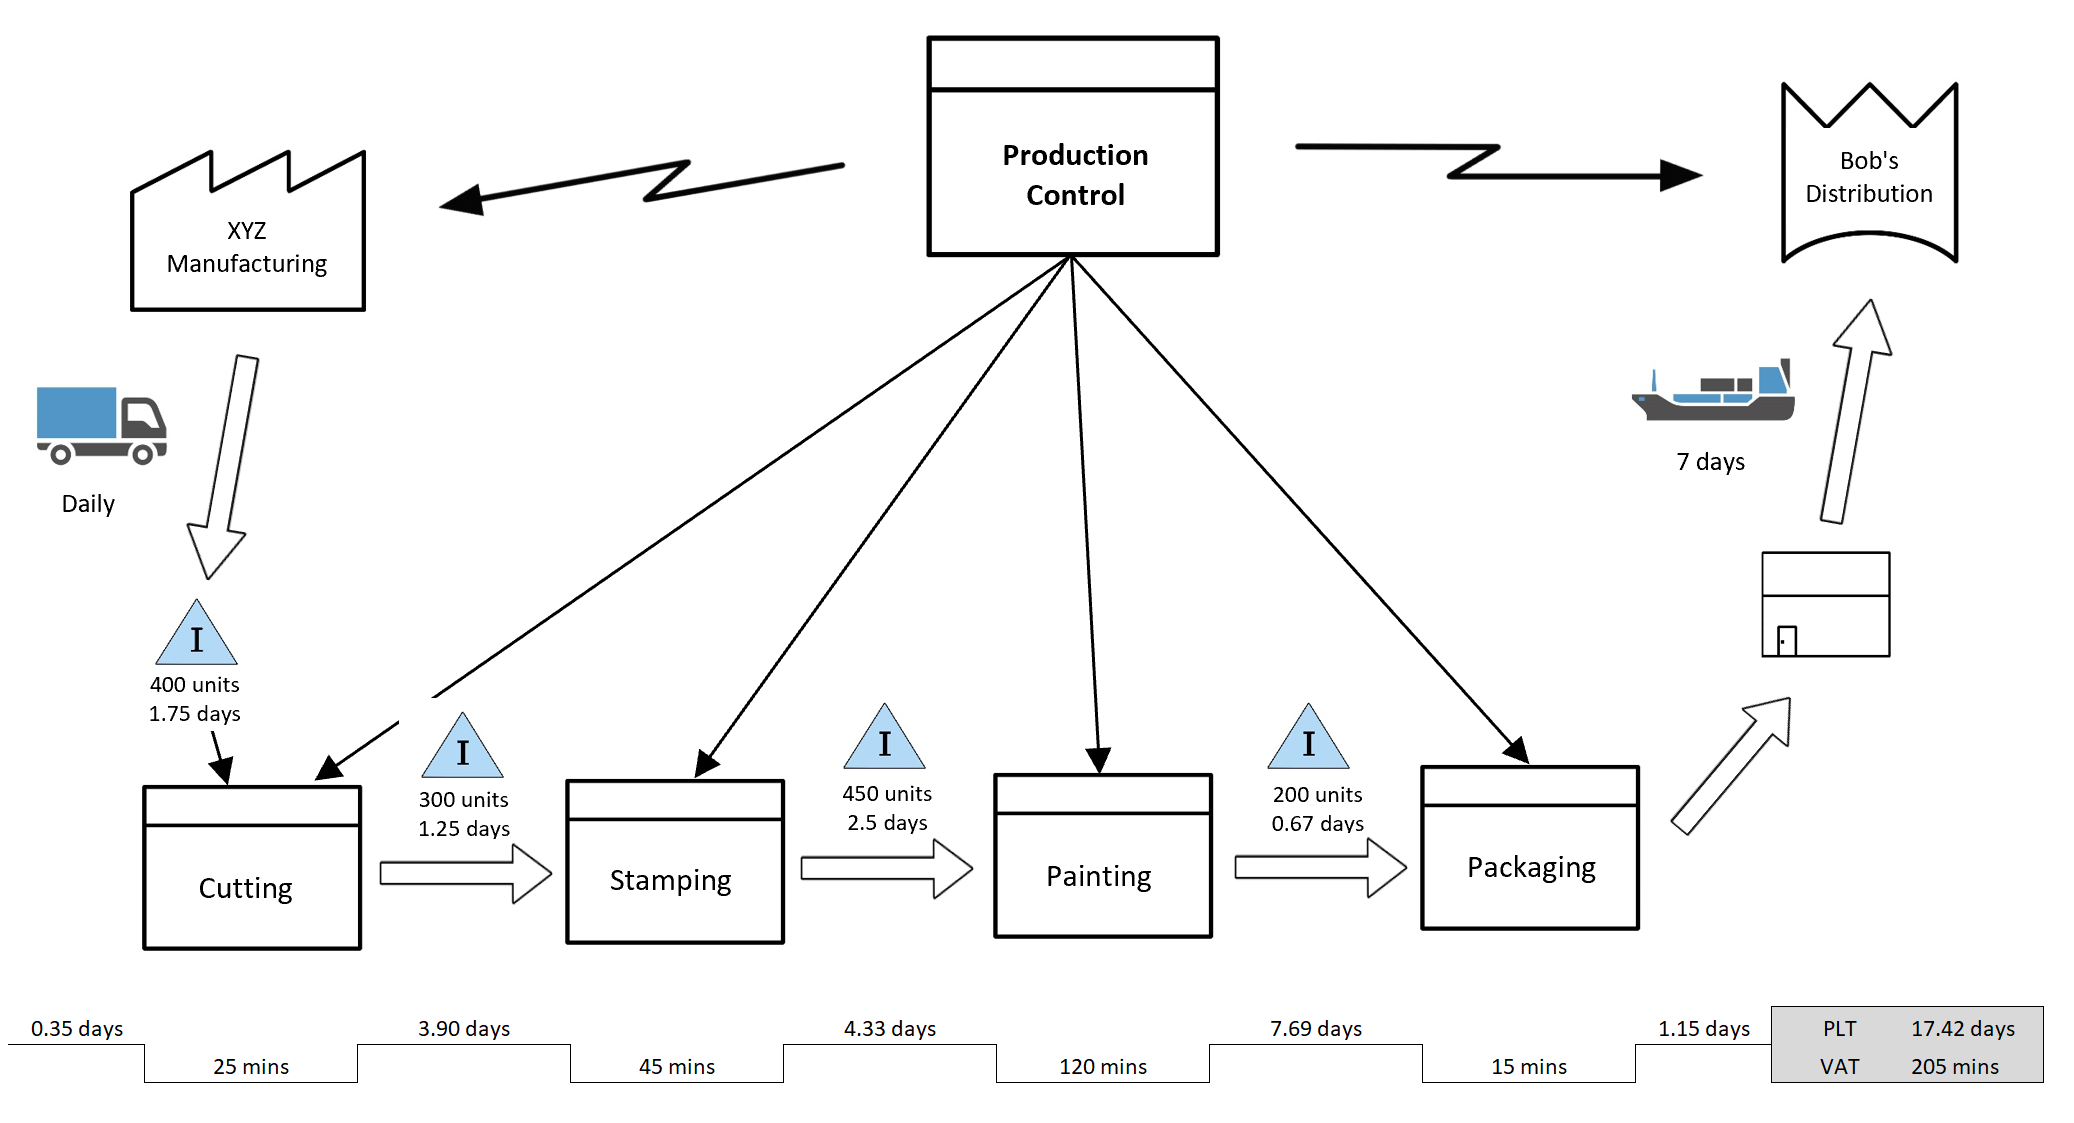
The whole manufacturing process is a series of steps of processing, then waiting, then processing again. The processing time is VAT, and the waiting time is PLT. It does not matter whether the material is waiting at the tail end of one production step or the front end of the next, the whole waiting time between VAT processing time is recorded as PLT.
In most plants, the PLT is significantly more than the VAT, which creates inventory storage requirements on the production floor. Inventory is one of the 7 types of muda (waste) which should be reduced or eliminated.
Lean manufacturing seeks to optimize the production process and eliminate the muda. For a traditional (non-lean) production plant, the main processes needed to become lean are:
- All VAT’s should be the same length. This eliminates the need for inventories between steps. For example, if one step takes 20% longer than the next, that station will be idle 20% of the time (or 20% inventories will need to accumulate in front of the first one). Furthermore, when all VAT’s are synchronized, this becomes the rate at which the plant produces its final product, and this can be matched to customer demand (called the takt time). The plant sings its song at a perfect rhythm and production is at an optimum. Alternatively, a production step can have more than one “operator” allowing for processing of multiples of units within the same VAT time, at a double, triple, etc. multiple of quantity.
- Eliminating the PLT. In lean manufacturing, the goal is to move raw materials all of the way through the production process and into the customer’s hands without stopping (thereby maximizing cash flow). Hence, ideally there is no wait time between stations, although in practice this is usually not possible. Most plants have a wide variety of muda that necessitate some PLT, but removing all requirements for waiting should be a constant focus of management.
- Reducing variation. When all VAT’s are the same, inventories between stations are created from variation in processing times. For example, the VAT is recorded as the average production time of each step. But if the variation is high, say 10 minutes one time and 5 minutes the next, inventories will need to accumulate in front of the next step to allow it to function continuously.
- Multiple, parallel production lines. To scale up production levels, multiple parallel lines allow for small machines that are quickly changed over and don’t jeopardize the plant’s production when they break down.
On a most general level, lean manufacturing seeks to minimize the time that material is spent in non-value added wait time, as opposed to traditional (non-lean) manufacturing which seeks to maximize the uptime of machines and operators.
The Main Value Stream Mapping Symbols
Value stream maps employ standard symbols that are generally accepted by the lean manufacturing community. The main symbols are:
| Symbol | Name | Description |
|---|---|---|
| Process | The process box shows one step in the production process. It is labeled with the name of the process, eg. Painting. The small box can be used to show an information technology system. | |
| External Supplier | External suppliers, vendors, and material sources. The name of the organization should be written within the symbol. | |
| Customer | The customer who takes delivery of the products. The name of the organization should be written within the symbol. | |
| Information flow | A simple arrow is used to depict information flow. Usually this happens with the production control center and the other processes within the system but information flow is required wherever it is necessary. | |
| Electronic information flow | A broken arrow is used to represent emails and other sources of electronic information flow. | |
| Transport | An open arrow is used to represent the flow of production materials, from raw materials to finished goods. | |
| Expedited transport | When material movements need to be expedited, use this symbol. | |
| Inventory storage | The storage of inventory at any stage within the production process. The average inventory amount and time spent at the inventory step should be noted. | |
| Ground transportation | Transportation via truck. The frequency of shipments should be noted. | |
| Rail transportation | Transportation via rail. The frequency of shipments should be noted. | |
| Air freight | Transportation via air. The frequency of shipment should be noted. |
The full list of value stream mapping symbols includes all of the processes needed to adequately map and communicate the production process.