Six Sigma is a methodology for eliminating defects in a manufacturing process. Although its origins are in the manufacturing industries, it can be used to increase product quality in any situation where a product is being produced.
Six Sigma was developed by Motorola during the 1980’s and subsequently adopted and popularized by General Electric (GE) during the 1990’s. GE’s famous CEO Jack Welch, a chemical engineer, implemented it throughout the organization. In his book “Straight from the Gut” he said that he figured that GE had saved $1 billion per year because of it.
Six Sigma Methodology
If you throw darts at a dart board, you might hit some bullseyes, and you might miss the board a few times, but most will be in some sort of average middle ground. Similarly, in a manufacturing process most products will be defect free but a certain (hopefully small) percentage will be defective. The distribution of the data should be relative uniform, therefore we attempt to fit it to the normal distribution.
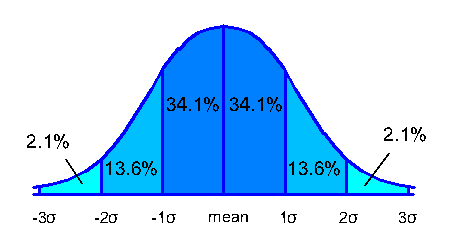 The standard deviation represents the spread of the data, in other words, the “wideness” of the curve. You will notice that the standard deviation is represented by a greek letter sigma (σ) on the x-axis. To apply real life data to the normal distribution, you calculate two things:
- Mean (average)
- Standard deviation
The percentages that fall into each standard deviation (34.1%, 13.6%, and 2.1%) are always the same. In other words, 34.1% of the data is always within 1 standard deviation above (or below) the mean. Only the size of the standard deviation (x-axis) is changed to match the data set you’re working with. The curve becomes flatter or wider to match the data.
If the curve is tall and narrow, most of the data is very close to the mean. Likewise, if the curve is short and wide, the data is very spread out and far away from the mean.
In Six Sigma methodology, the target (goal) is to limit product defects to six standard deviations, i.e. six “sigmas.” The Upper Specification Limit (USL) is three standard deviations above the mean, and the Lower Specification Limit (LSL) is three standard deviations below the mean. These represent the limits of acceptable production defect rates, and they are fixed by Six Sigma methodology.
The total of all the percentage values within 3 standard deviations from the mean is 99.73% (they have been rounded in the above chart). Therefore, the six sigma standard represents:
- 3.4 defects per million products
- 0.00034% defective.
As you can see, a “six sigma process” is virtual perfection. Any process can be described by how many defective products there are in terms of standard deviations, for example:
This means that 95.45% are within specifications (two standard deviations) and 4.55% are defective.
The 1.5 Sigma Shift
Because there are variations in manufacturing processes over time, you can’t be completely certain that the mean will always stay constant. For example, a manufacturer of vehicle doors might use Six Sigma methodology to set the upper and lower specification limits for paint color, only to realize in several years time that the mean paint color has changed due to creep in the manufacturing processes. Of course, if the slow change of the paint color is not acceptable then the process needs to change regardless of the Six Sigma method. But a small variation in the mean should be taken into account up front, and thus Six Sigma accounts for the long term variation of the mean by using a one and a half sigma “shift.”
This means that the distribution used to set the specification limits in Six Sigma is not the actual mean, but the mean plus or minus 1.5 standard deviations.
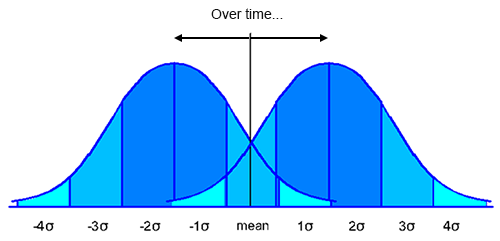
Thus, to ensure that the final result is within the specification limits, the goal is not actually 6 standard deviations, but 4.5. The other 1.5 sigmas are to account for the drift of the mean over time.
To achieve a six sigma quality level, there are two processes which are used.
- Improve Existing Processes: Define-Measure-Analyze-Improve-Control (DMAIC) is pronounced “Demayik”
- Design New Processes: Define-Measure-Analyze-Design-Verify (DMADV) is pronounced “Demadvee”
Improving Existing Processes with DMAIC
When you are looking to improve an existing process:
- Define the problem and the metrics which are most important to measure success. Define the Critical-to-Quality (CTQ) issues.
- Measure the current process and document the baseline performance.
- Analyze the top causes of the defect. Many techniques can be used in this phase including Pareto Charts, Fishbone Diagrams, and Regression Analysis.
- Improve the process by testing various alternatives and implementing an action plan.
- Control. Implement controls to ensure that the defect does not re-occur over time.
Designing New Processes with DMADV
When designing a new process, the first three steps are the same.
- Define. See DMAIC.
- Measure. See DMAIC.
- Analyze. See DMAIC.
- Design the process which will produce the desired result.
- Verify that the process will produce the desired result.
Although the first few steps are the same, their execution will feel slightly different when a process is not already in place.
Six Sigma Tools
To carry out the above steps, Six Sigma practitioners use the following tools:
- Pareto Charts
- Design of Experiments (DOE)
- Analysis of Variance (ANOVA)
- Regression Analysis
- Failure Mode and Effects Analysis (PFMEA)
- Fishbone Diagrams
- Time Series Plots
- Hypothesis Testing
- Histograms
Six Sigma Certification
There are three levels of certification which six sigma practitioners can obtain:
- Green Belt. These practitioners represent the workers who carry out the six sigma improvement projects. They use the DMAIC and DMADV methodologies to improve product quality and measure the results. They present the findings of six sigma improvement projects to more senior staff.
- Black Belt. These are the leaders of six sigma projects. They initiate and plan six sigma improvement projects. They analyze the results and make decisions regarding the implementation of the green belt’s recommendations.
- Master Black Belt. These practitioners manage the overall six sigma program. They do not manage individual six sigma improvement projects, rather they identify potential projects, and ensure the overall viability of the product quality system.
Applicability of Six Sigma
Six Sigma was developed for manufacturing processes, but it’s methods can be widely applied across other industries with some modifications. For example, an engineering consulting firm could measure the Cost of Quality by measuring the number of hours spent on review changes, or tabulate the number of reports that fell below certain quality parameters (pareto charts and histograms). A software development firm could use DMAIC to prioritize product upgrades and reduce customer service costs.
The concept of Six Sigma applies in any industry, even if you are not producing millions of widgets. You may not be measuring defects in minute percentages, per thousands or millions of units. But a Six Sigma green or black belt can produce quality improvements in any industry, even if the ground level concept of six standard deviations has less meaning in that environment.