
The Program Evaluation and Review Technique (PERT) is a great way for project managers to organize and prioritize tasks. PERT charts are a central part of any project management course. They are quick to draw and intuitive to use.
How to Draw a PERT Chart
There are two rules:
- Tasks (activities) are represented as arrows
- Milestone dates are nodes
PERT charts are also called activity-on-arrow diagrams (project manager’s slang). If drawings need two weeks to complete before a report gets submitted, you would write:

If you have multiple simultaneous activities, for example an environmental permit application while the drawings are being completed, you would write them side by side, joining back up to the common milestone date (node). The longer pathway is easily visible.
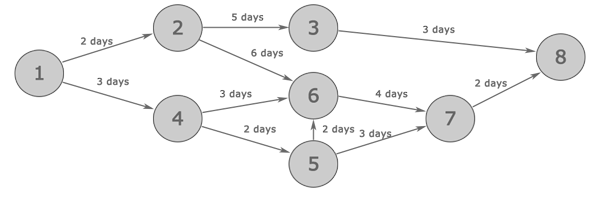
That’s not too difficult is it? At any given time you can see whether a milestone date (node) is complete and what type of timelines you are looking at relative to the final (project complete) milestone.
Interpretation
What can you do with a PERT chart?
- Using the forward pass method, you can determine the earliest possible dates for each milestone. To use the forward pass method, you start by writing a 0 (as in, “day 0”) on the first node (in our example, node 1). Then proceed from left to right through each path, adding up the duration of each activity and writing the milestone dates on each node. Milestones can have multiple dates at this point, if they are part of multiple paths. Once you get to the right side, you go back through the chart and choose only the highest date for each milestone (node) and discard the others. These is the earliest possible dates for the milestones. Also, the overall project completion date is the highest date on the last milestone.
- Using the backward pass method, you can determine the latest possible date for each milestone. Just like the forward pass, but opposite, you start on the right, using the highest date on the last milestone (the completion date). Proceed through each possible path and write each date on the nodes by subtracting the activity durations. Then choose only the lowest date for each milestone and discard the rest. These are the latest possible dates of the milestones.
- For each milestone, you can subtract the earliest possible date from the latest possible date to get the float. This is the amount of play that each activity has before it affects the critical path.
The following table illustrates the results from the above example:
| Milestone | Earliest | Latest | Float |
|---|---|---|---|
| 1 | 0 | 0 | 0 (critical path) |
| 2 | 2 | 2 | 0 (critical path) |
| 3 | 7 | 11 | 4 |
| 4 | 3 | 4 | 1 |
| 5 | 5 | 6 | 1 |
| 6 | 8 | 8 | 0 (critical path) |
| 7 | 12 | 12 | 0 (critical path) |
| 8 | 14 | 14 | 0 (critical path) |
You can also generate the table in terms of activities rather than nodes.
- The Earliest Start (ES) date is the earliest possible date that the task can start given all of tasks before it. It is the same as the earliest milestone date for the milestone immediately to the left of the task (i.e. from the forward pass, the highest number on the node immediately to the left).
- The Latest Finish (LF) date is the latest possible date that the task must be complete without affecting the overall completion date. It is the same as the latest milestone date for the node immediately to the right of the task (i.e. from the backward pass, the lowest number on the node immediately to the right).
- The Latest Start (LS) and Earliest Finish (EF) dates are calculated from the other two by the somewhat obvious addition or subtraction of the task duration.
- LS = LF – Duration
- EF = ES + Duration
| Activity | Duration | Earliest Start (from forward pass) |
Latest Start (LF – Duration) |
Earliest Finish (ES + Duration) |
Latest Finish (from backward pass) |
|---|---|---|---|---|---|
| 1-2 | 2 days | 0 | 0 | 2 | 2 |
| 1-4 | 3 days | 0 | 1 | 3 | 4 |
| 2-3 | 5 days | 2 | 6 | 7 | 11 |
| 2-6 | 6 days | 2 | 2 | 8 | 8 |
| 4-6 | 3 days | 3 | 5 | 6 | 8 |
| 4-5 | 2 days | 3 | 4 | 5 | 6 |
| 5-6 | 2 days | 5 | 6 | 7 | 8 |
| 6-7 | 4 days | 8 | 8 | 12 | 12 |
| 5-7 | 3 days | 5 | 9 | 8 | 12 |
| 3-8 | 3 days | 7 | 11 | 10 | 14 |
| 7-8 | 2 days | 12 | 12 | 14 | 14 |
I prefer using milestones instead of activities to generate the table, because it’s a bit more intuitive and the calculations can be remembered easier.
Critical Path
Clearly, there is one path that results in the overall project completion date, and all the others have some float. This is called the critical path, and a good project manager will not only know what it is, but keep a good eye on those tasks throughout the project. It sounds obvious, I know, but you’d be surprised how many project managers for million dollar projects just “fly by the seat of their pants.”
Float
If a task is not on the critical path, it has float and can be sacrificed for resource allocation, budget, or other purposes. The amount of float is very simple:
- Float = Latest Start – Earliest Start
- F = LS – ES
When Float = 0, the activity is on the critical path.
When to Use a PERT Chart
PERT charts serve multiple purposes for the project manager.
At the beginning of the project they are a good tool for calculation of the project duration and for knowing what the important tasks are. You probably already do this. When something comes up, you think about the tasks involved, which order they go in, and which ones you need to do on time to ensure the overall completion date (critical path). The PERT chart is effectively nothing more than the hard copy of your thought process.
During the project, PERT charts are a good tool for calculation of the critical path and float, especially when the project changes, but they are not the best at showing you what your project team needs to be working on right now. Thus, I find they are more of a project control technique, answering questions such as:
- Is your project deadline in jeopardy?
- Do you need to allocate more resources to a certain task?
Have you every drawn a PERT chart? Tell us how you did it and how it impacted the project?