You have a malfunction. Or your project ran into problems. Or your plant’s production has fallen.
There could be one main reason, or several reasons for the negative event. There could be a chain of events which was initiated by a root cause. How do you decipher the complex web of events which culminated in the negative outcome?
You need a root cause analysis.
What is a Root Cause Analysis?
A Root Cause Analysis (RCA) is a procedure for identifying the underlying causes of a negative event, to fix the problem or prevent its re-occurrence.
The root cause is the issue that, had it not occurred, the problem would not have occurred. Many causal factors can be present which are not definitive in their contribution to the problem, or which made the problem worse but didn’t cause it.
Hence, there are three types of causes:
- The root cause is the reason a problem occurs. If the root cause had not occurred, the problem would not have occurred. The root cause can be the first in a sequence (chain) of interdependent causes.
- Causal factors contribute to the problem, but aren’t the reason the problem occurs. Causal factors exaggerate the problem or cause residual problems, but their presence isn’t definitively linked to the problem. Confusion between causal factors and root causes are often a major source of indecision.
- Non-causal factors did not influence the problem.
To perform a root cause analysis, every underlying issue must be brainstormed and placed into the above three categories.
How to Perform a Root Cause Analysis
 Although there is no one guidebook for performing a root cause analysis, there is a generally accepted sequence of 5 steps:
- Define and Understand the Problem
A problem has surfaced that requires a solution. Although it may seem like identifying the problem is an unnecessary formality, most problems benefit from a thorough investigation. What happened? What are the symptoms, and how can they be classified and documented? It is surprising how often you tend to look back at later stages and wonder about the specifics of what actually happened. Measurements and data are your friend. Also, making conclusions too early in the process is not your friend, as it results in confirmation bias – i.e. placing too much emphasis on evidence that supports your pre-determined conclusion. - Determine causal factors
At this stage all of the causal factors are brainstormed with little regard for the relationships between them. The important thing is to get everything on paper so that nothing is missed. Some things will end up being designated non-causal factors, however this is not the concern at this stage. It is more important not to miss an important link in the chain than to investigate something that doesn’t end up being part of it. In other words, everything that happened prior to the problem is thoroughly researched and documented. Furthermore, a stakeholder list is established from people or organizations that have an interest in the problem, which includes everyone from the affected parties down to the operators and mechanics who will be performing the solution. Five methods of eliciting causal factors are used:- Brainstorming
Anything and everything is thrown onto a whiteboard (or other tracking medium) and then whittled down to the most important ones. - Document analysis
The related documentation, correspondence, government files, and so forth, can yield causal factors that were not available otherwise. - Facilitated workshops
Stakeholders are brought together in any format (formal meeting down to coffee discussion) to discuss how the problem affects them. - Interviews
Stakeholders are consulted in a one-to-one format to gain their insight. - Observation
The business processes are observed and insights are obtained from watching people do their jobs.
- Brainstorming
- Determine the relationships between causal factors
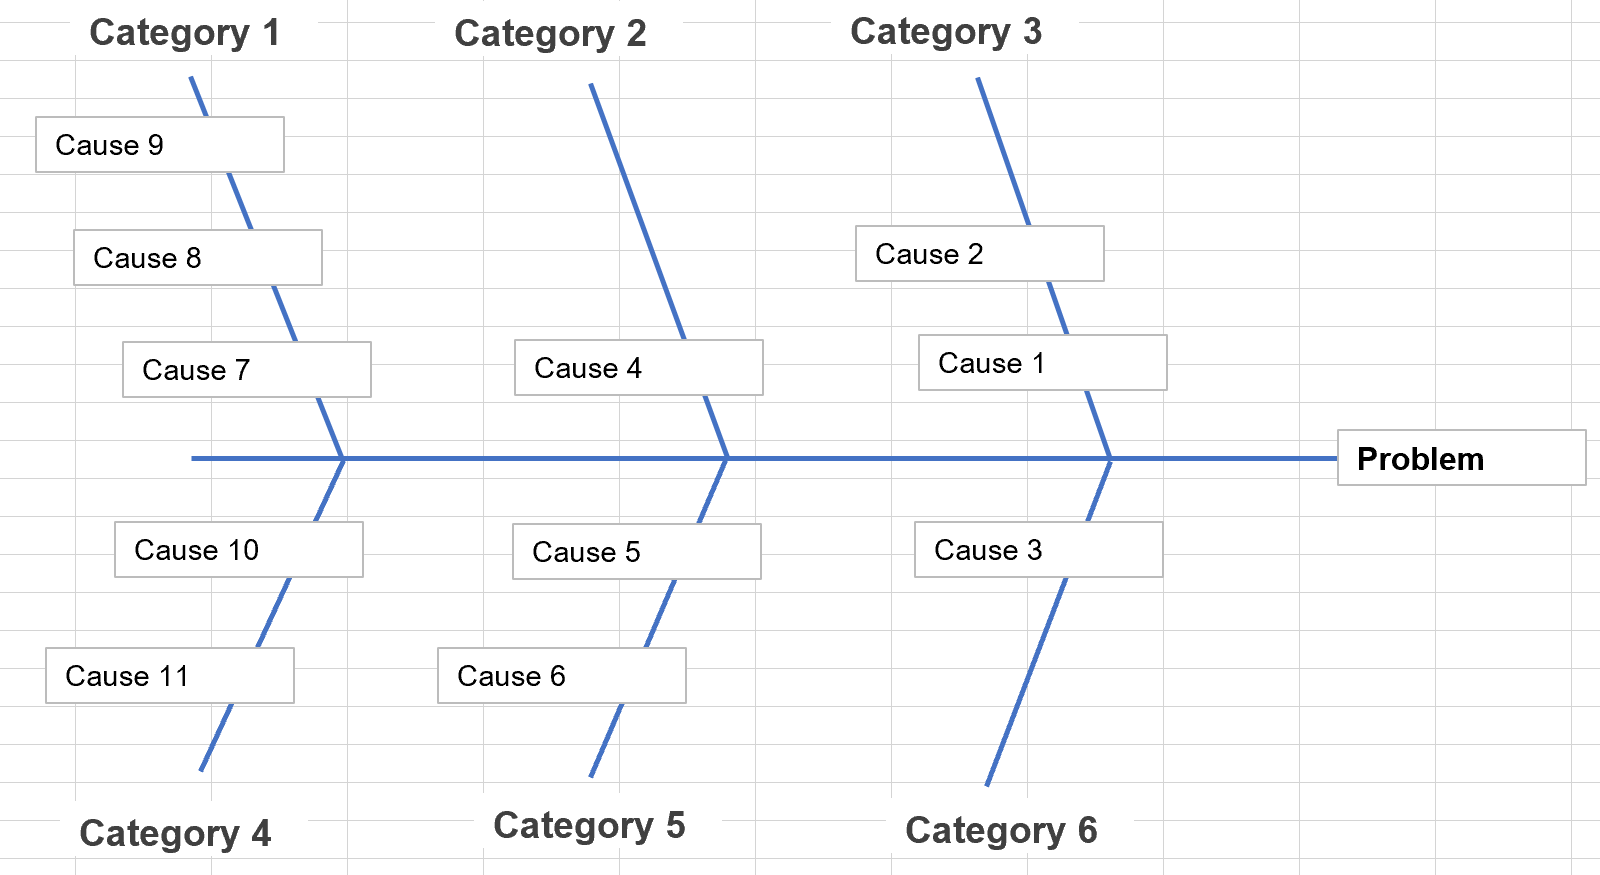
Once all of the causal factors are itemized and documented, the relationships between them are determined. Some factors will be the cause of others, which will in turn be the cause of others. A chain link of events is constructed which shows which events happened because of other events. This is called a fishbone diagram (sometimes called an Ishikawa diagram) and clearly shows the cause-effect relationships between the causal factors.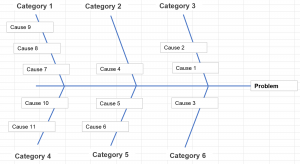 If there is only one factor that caused the problem (with no other factor behind it) it occupies the sole spot in its arm of the diagram, but any causes that are affected by other causes become a link.
 - Determine the root cause
Once the fishbone diagram is complete, the root cause is determined as the arm that would have eliminated the problem had it not occurred. All of the others are causal factors that may have made the problem worse but did not create it. It is possible to have two or more root causes, but more than two should be strongly avoided because it is unlikely that multiple underlying events can play an existential role in a problem. There should be only one root cause, two in rare cases. - Implement a solution
Although this article is about finding the root cause of the problem, implementing the solution is the final step in the process. Strong decision making and execution skills are paramount, and communication can be the key to stakeholder acceptance of the decision.
In a plane crash, which is the ultimate form of root cause analysis, all of these steps can be seen very clearly. Firstly, every piece of evidence is painstakingly itemized and categorized. Secondly, every causal factor is brainstormed from every possible perspective and drilled down into successive “why’s” until no more links in the chain exist. Then the causal factors are tested to determine which one is the root (or roots) without which the crash wouldn’t have happened. There are almost always many other causal factors that have contributed, but are essentially noise – without them the problem still would have happened. The investigation will recommend improvements on both the root cause as well as the causal factors.
The Five Why’s
One of the great geniuses of manufacturing, Taiichi Ohno of Toyota, devised a system for finding the root cause of production issues on the manufacturing floor. Ohno theorized that by asking the question “why” five times, the root cause of almost any issue can be determined.

The 5 Why’s is an attempt to find the root cause of an issue. For example, a machine has stopped working:
- Why did the machine malfunction?
The gearbox failed which caused the machine to stop - Why did the gearbox fail?
One of the smaller gears broke - Why did the gear break?
It had passed its normal operating life span - Why did it pass its normal operating life span?
The maintenance technician was scheduled for next month - Why was the maintenance technician not available?
The lead time on calling maintenance must include the purchase of spare parts and installation.
SOLUTION: Maintenance must be called with sufficient lead time to purchase spare parts and perform the installation.
The Toyota production system used a process of continuous improvement (called kaizen) to methodically look for areas of non-peak efficiency (called muda) within the assembly process. Because of Toyota’s rapid ascent from near ruin after WWII to become the world’s largest automaker, its processes have been rigorously inspected and have resulted in the modern concept of lean manufacturing. The chief architect of Toyota’s system, Taiichi Ohno, introduced the concept of 5 Why’s in his book The Toyota Production System (1988).
Root Cause Analysis – Example
A railroad company has experienced a derailment which caused a spill. The company works through the four steps to determine the root cause of the accident: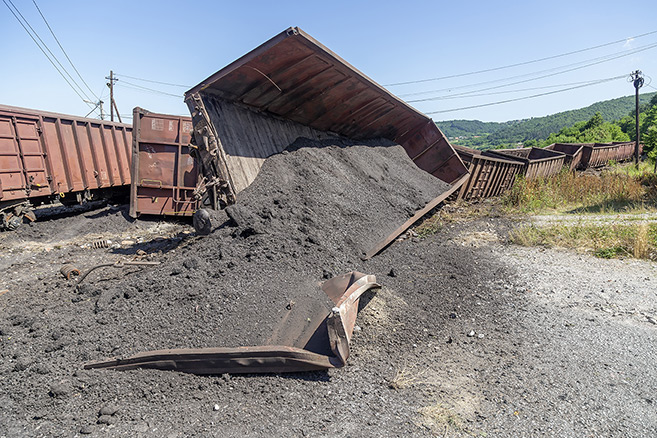
- Define and Understand the Problem
The investigators determine the exact location where the rails came off the tracks. They measure how far the tracks and wheels were damaged. They sketch out the final location of each train car and map the route that they took from initial derailment event to final resting spot. They document all of the evidence, some of which will be destroyed, even that which they don’t know where or when it will be used yet. - Determine causal factors
The investigators hold several meetings whose purpose is to identify any and all contributing causal factors. A broad range of expertise is involved in these meetings, including engineers and rail maintenance crews. Without regard to relationships between causal factors, all of the factors are listed and described in enough detail that they are well understood. For example,- The track failed due to long term fatigue
- The maintenance crews inspected the track at a longer interval than other sections
- Determine the relationships between causal factors
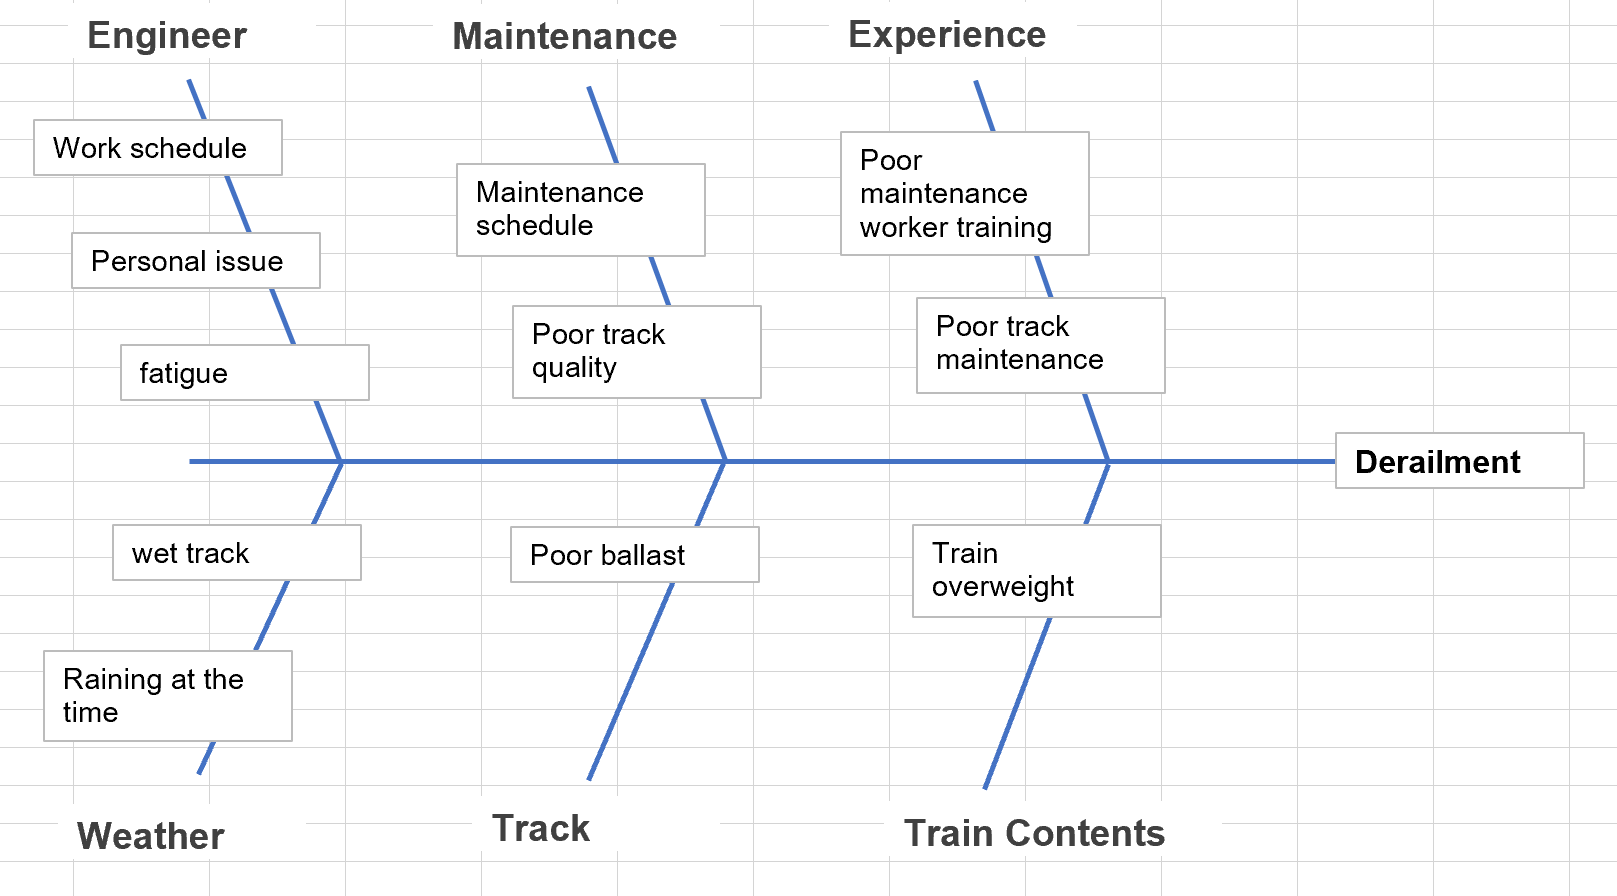
The Ishikawa (fishbone) diagram is used to communicate that the lack of maintenance resulted in poor track quality, and subsequent failure of the track. Other arms of the diagram include things like weather conditions, engineer awareness and performance that day, and the weight of the train.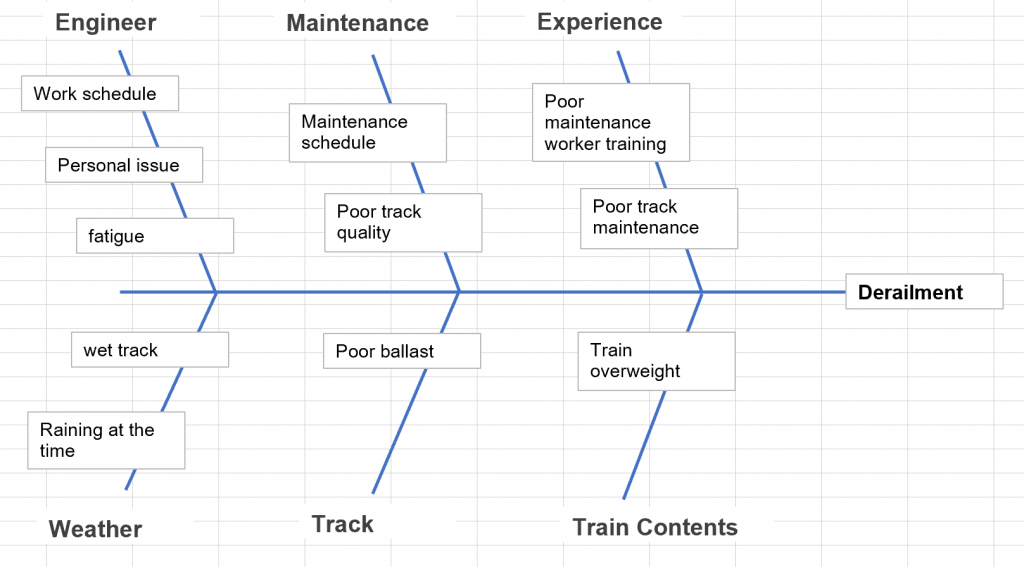
- Determine the root cause
The root cause is determined as the poor track quality. The other arms of the Ishikawa (fishbone) diagram are deemed to be contributing factors but not the root cause. - Implement the solution
The company implements a policy to inspect all track at the same interval.