
In its most basic form a project schedule is a list of tasks with assigned start and finish dates. It can also be a graphical bar chart produced with project management software or in a spreadsheet.
In professional schedule development, a critical path analysis using a network diagram produces the critical path tasks and their floats. Since a graphical bar chart (gantt chart) cannot determine the critical path tasks, that is, the tasks that determine the completion date of the project, the network diagram precedes the development of the schedule. The critical path method also determines the earliest start and finish dates, and the latest start and finish dates, for each task, which will be forwarded into the graphical schedule development.
Project managers should know which tasks are on the critical path so they can always be given the necessary attention to keep the project on track.
Let’s take a look at the Project Management Body of Knowledge to see where the critical path analysis fits.
PMBOK, 5th Edition, Section 6.6, “Develop Schedule”
Develop Schedule is the process of analyzing activity sequences, durations, resource requirements, and schedule constraints to create the project schedule model. The key benefit of this process is that by entering schedule activities, durations, resources, resource availabilities, and logical relationships into the scheduling tool, it generates a schedule model with planned dates for completing project activities.
The critical path method uses a five step process:
- Draw the Network Diagram
- Enter durations
- Perform the Forward Pass
- Perform the Backward Pass
- Enter floats
Drawing the Network Diagram
To determine the critical path a network diagram is necessary. There are two types of network diagrams:
- Activity-on-arrow
- Activity-on-node
The Activity-on-arrow approach was used in the old PERT method but has largely been deprecated in favor of Activity-on-node. As you will see below, the critical path method essentially requires an Activity-on-node setup. The Activity-on-arrow method would be unwieldy in figuring out the critical path tasks.
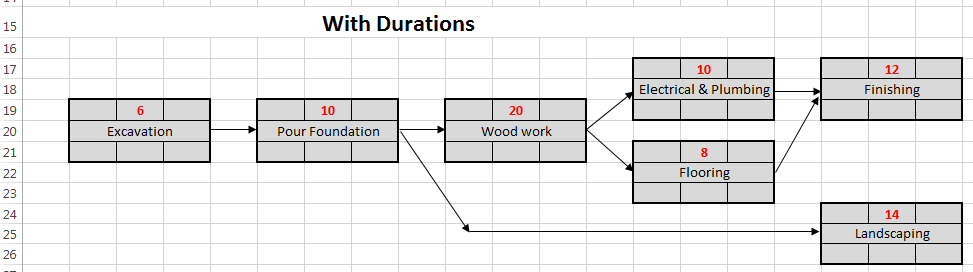
Although software is a big time saver for the network diagram, it can be done in Microsoft Excel, especially if you have less than about 10 tasks. Here is the example for the log home project in MS Excel.

Enter Durations
This step is pretty straight forward. Simply insert the task durations into the top middle box. Click on the graphic to make it larger.
Perform the Forward Pass
The forward pass starts at the left hand side of the network diagram and proceeds to the right. It determines the Earliest Start (ES) and Earliest Finish (EF) of each task. These are defined as follows:
- Earliest Start (ES): The earliest date that the task can start.
- Earliest Finish (EF): The earliest date that the task can finish.
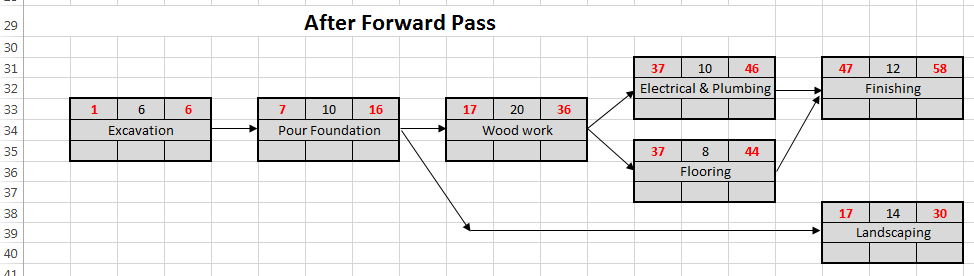
The forward pass also defines the project completion date, because once the Earliest Finish of the final task is determined you can simply add the task’s duration to obtain the completion date of the project.
The sequence to performing a forward pass are:
- Start by entering a “1” in the top left box of the first task. This is the earliest start (ES) date of the first task, and the starting date for the project.
- Determine the earliest finish (EF) of the first task and enter it into the top right box. EF = ES + Duration – 1. Note that the ES and EF dates are both inclusive of the task duration, therefore a one needs to be subtracted.
- Proceed to the ES of the second task. ES2 = EF1 + 1. The ES of each task is simply one day after the EF of the previous task.
- Proceed through each task by entering the ES and then the EF. When you have two EF’s to choose from, as you do with task 330, Finishing, choose the higher one.
The network diagram for the log home project example, after the forward pass, looks like this:
Perform the Backward Pass
The backward pass starts from the right side of the network diagram and proceeds to the left. It determines the Latest Start (LF) and Latest Finish (LF) of each task. These are defined as follows:
- Latest Start (LS): The latest date that the task can start.
- Latest Finish (LF): The lates date that the task can finish.
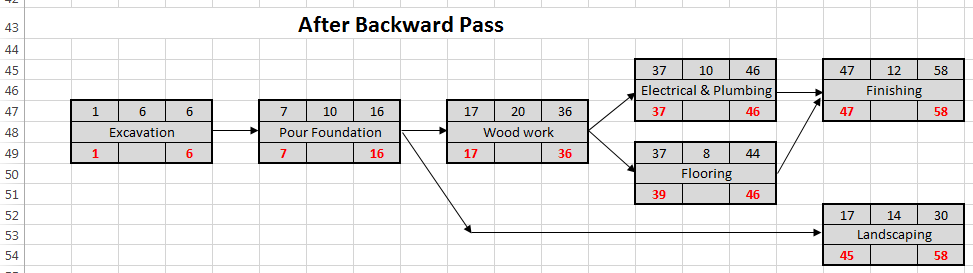
The sequence to performing a backward pass are:
- Start by choosing the highest EF of the final tasks, from the forward pass, and enter it into the bottom right box for each final task. In this case, 330 – Finishing, and 410 – Landscaping are both final tasks. The higher EF is 58. This value goes into the LF for both.
- Determine the latest start (LS) and enter it into the bottom left box. LS = LF – Duration + 1.
- Proceed to the LF of the previous task. LF1 = LS2 – 1.
- Proceed through each task by entering the LF and then the LS. When you have two LF’s to choose from, as you do with task 210 – Wood work, choose the lower one.
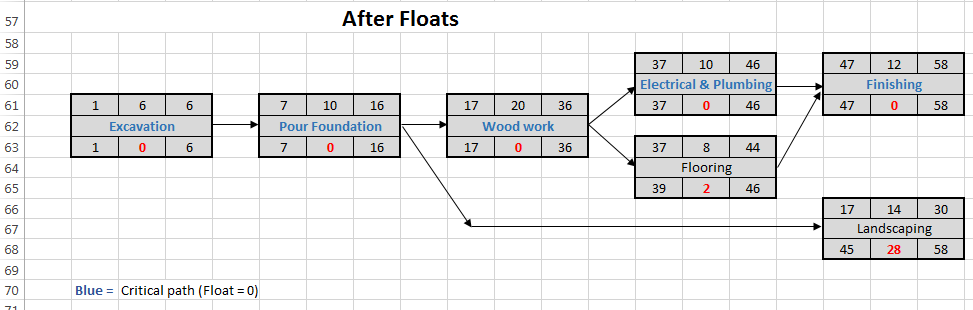
Enter Floats
Enter the float for each task in the bottom, center box. Float = LS – ES. This will be used in the bar chart (also called Gantt Chart) coming up in the next step.
The Critical Path
The critical path tasks are those where:
Float = 0
To put it another way, LS = ES, or the bottom left box and the top left box are equal. Alternatively, LF = EF; These two conditions will either both be true or both be false. When using a spreadsheet like in our example, it might be advantageous to highlight the critical path tasks, because the graphical bar chart will not otherwise show them.
The critical path tasks determine the completion date of the project. A delay in any one of them will delay the project completion date. For this reason project managers must know which tasks are on the critical path so they can take immediate action when their completion dates are in jeopardy.
By now you know that if a task on the critical path requires a longer duration than has been scheduled for it, the overall project will be extended by the same amount. However, if a task on the critical path completes early, the project is not necessarily early by the same amount because a parallel path through the network might become the new critical path. The amount of float is a big indicator of how seriously to take the task. If the float is only one day, for example, it’s very close to the critical path and needs to be managed as such.
Once the forward and backward pass are completed, the ES and float of each task are known. These are the two variables which are carried forward into the final step of drawing the graphical bar chart, also known as a Gantt Chart.