
Ensuring your project finishes on time is a core component of project management. To pass any project management exam, you must know how to calculate the critical path.
There are 6 steps to the Critical Path Method:
- Divide the project into tasks
- Estimate duration
- Create the network diagram
- Draw initial Gantt (bar) chart
- Perform resource levelling
- Compress the schedule (if necessary)
Divide the Project into Tasks
The first requirement is to divide the project into tasks, also known as activities. Ideally, each task should have one responsible party and be easy to estimate. For example, excavation and pouring concrete might have separate responsible parties (contractors, etc.) and should therefore be separate tasks.
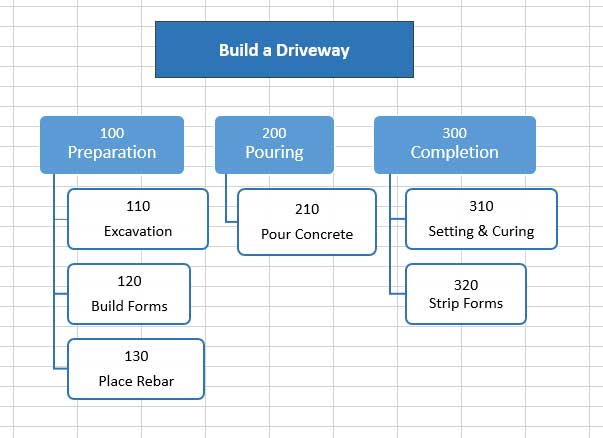
Here’s a hypothetical task list for a driveway construction project. This is also called a work breakdown structure.
| Task List | ||
| Task No. | Name | Dependencies |
|---|---|---|
| 110 | Excavation | |
| 120 | Build Forms | 110 |
| 130 | Place Rebar | 110 |
| 210 | Pour Concrete | 120, 130 |
| 310 | Setting & Curing | 210 |
| 320 | Strip Forms | 310 |
A graphical style is sometimes helpful, but not a necessity:
The task list can also contain “activity attributes,” which identify meta-level information about the task. For example, there could be a column called “Subcontractor”:
| Task List | |||
| Task No. | Name | Dependencies | Subcontractor |
|---|---|---|---|
| 110 | Excavation | ||
| 120 | Build Forms | 110 | Jon’s Concrete |
| 130 | Place Rebar | 110 | Jon’s Concrete |
| 210 | Pour Concrete | 120, 130 | Jon’s Concrete |
| 310 | Setting & Curing | 210 | |
| 320 | Strip Forms | 310 | |
Estimate Tasks
Once the project has been divided into tasks, each task must be estimated. Two things need to be determined:
- Task Resources
- Task Duration
To estimate resources, here’s a typical table that would be produced for each task:
| 210 Pour Concrete | ||
|---|---|---|
| Type | Average Use | Total |
| Concrete | 12 yd3 @ $45/yd3 | $540 |
| Jon | 6 hours @ $25/hr | $150 |
| Sweat Equity | 6 hours @ $0/hr | $0 |
| TOTAL | $690 | |
Resources can take the following forms:
- Labor. This usually takes the form of hours or days assigned to the task or project. It’s easy to assume all labor is the same, but make sure you consider that experience and knowledge level vary drastically. For example, junior vs. senior laborers have varying levels of productivity. Also, for knowledge workers such as engineers, the addition of more of them tends to slow down decision making, negating some of the productivity gains.
- Equipment. Often equipment is sourced at hourly rates, or internally owned equipment has an hourly rate applied to it.
- Materials. If the project needs to purchase materials, their cost is often easy to estimate from published rates, or quotes can be obtained from suppliers.
- Fixed cost items, such as a subcontractor. This is a double edged sword, as a subcontractor’s costs are fixed, but they take responsibility for the schedule and quality of work away from you. Also, you must know the fine print, or else the costs might not nearly be as “fixed” as you think.
It is not only important to know what resources you need, but what their minimum specifications are. For example, you might know you need a crane, but how big of a crane? (I’ve seen the wrong size crane arrive at a site – I’m sure that cost the project some monopoly money). It’s not always so obvious though. Maybe you need a new printer to produce a large report but you purchase one that prints too slow and it severely bogs down the production process.
Each resource contains a resource calendar, which is, like it sounds, a calendar which shows the availability of the resource. Although the resources are finalized during the later step called Resource Levelling, one could spot the major gaps in resource availability at this step and set task durations accordingly.
Once this table has been produced, the durations must be estimated. Each task has one duration estimate value, which can be added to the bottom of the table:
| 210 Pour Concrete | ||
|---|---|---|
| Type | Average Use | Total |
| Concrete | 12 yd3 @ $45/yd3 | $540 |
| Jon | 6 hours @ $25/hr | $150 |
| Sweat Equity | 6 hours @ $0/hr | $0 |
| TOTAL | $690 | |
| Duration | 1 day | |
Unless there’s a reason not to, use the units of days, not hours, weeks, cubic metres of excavation, or anything else. The reason for this is that the graphical bar chart that is coming up in a few steps will require days as the x-axis, there is no other unit that works well. Also, if the project deadline is defined as a certain day (as it almost always is) then project control will be very complicated if you’re tracking against some other unit.
This process is called Bottom Up Estimating, whereby each task is estimated individually and then aggregated into the overall project estimate.
Create the Network Diagram
Next, the network diagram is used to produce the following two pieces of data:
- Activity Floats
- The critical path
Of course, the graphical representation of tasks is also very helpful to envision the project and ensure the relationships between each task are correct.
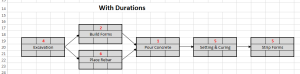
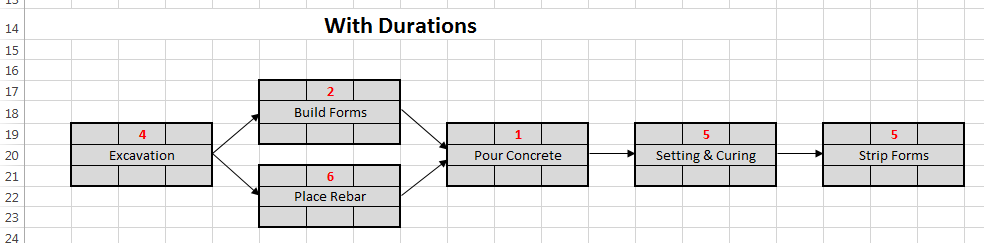
In the absence of other project management software you could use Microsoft Excel to produce a network diagram, like this:

The Critical Path is defined as the longest path through the network, which means it defines the minimum completion date of the project. During this step, the critical path and floats for each activity are determined, which is used to draw the gantt (bar) chart in the next step. The steps are as follows:
- Enter durations for all activities
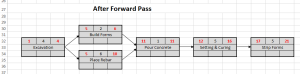
- Perform a Forward Pass, which identifies the Early Start (ES) and Late Start (LS) dates for each task. Starting with the first task, ES = 1. Then, LS = ES + Duration – 1. Note that both dates are inclusive to the task duration so the LS always requires the subtraction of 1 day. When passing through two parallel tasks, the higher LS is passed forward.
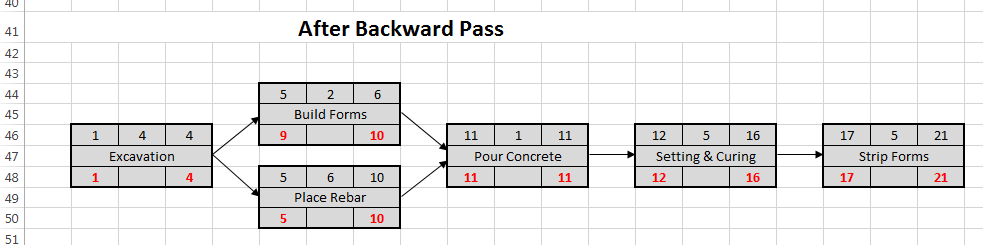
- Perform a Backward Pass, which identifies the Early Finish (EF) and Late Finish (LF) dates for each task. Starting with the last task, LF = EF. Then, EF = LF – Duration + 1. When passing through two parallel tasks, the lower EF is passed forward.
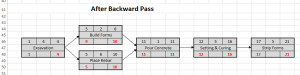
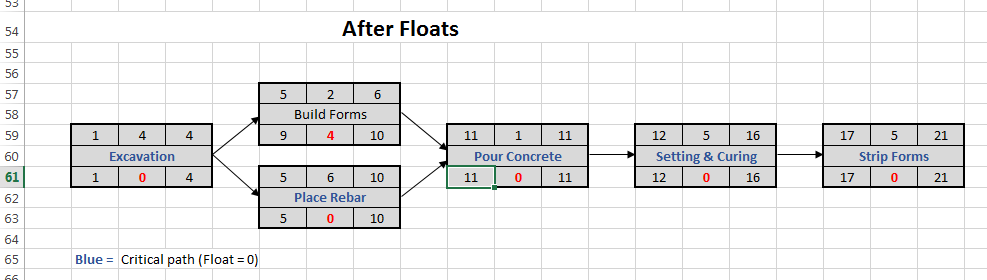
- Calculate float for each task. Float = LS – ES.
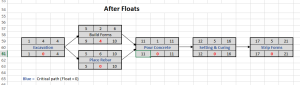

The project completion date was determined at the end of the forward pass. It is the EF (Early Finish) of the final task.
Draw Initial Gantt (bar) Chart
A horizontal bar chart that shows the start and end dates for each activity in the project is called a Gantt Chart. It is the nicest, cleanest and easiest way to communicate the schedule. The critical path can be highlighted, but it is not ideal for another critical path analysis if any changes are made. That is, schedule changes must revert back to the network diagram step.
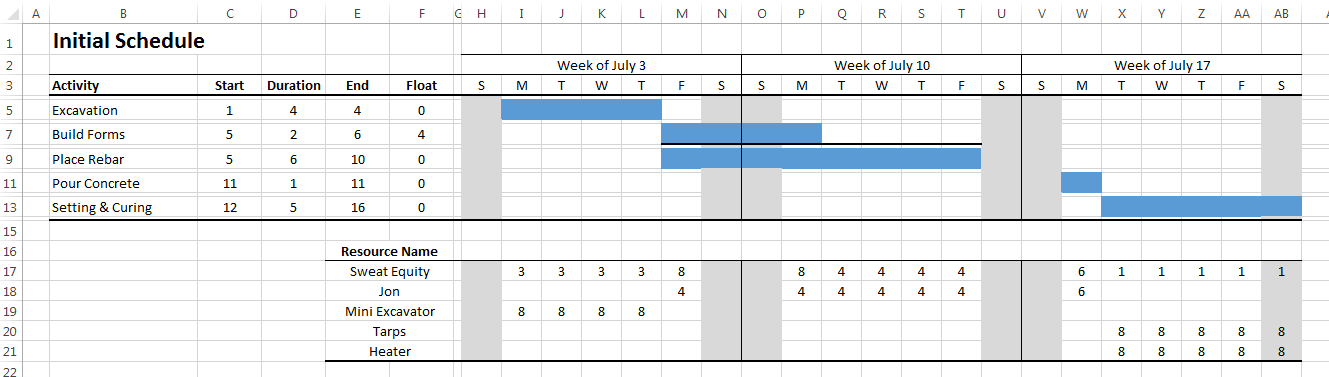
In the initial gantt chart the tasks are plotted on their Early Start (ES) dates. The resources required for each task are plotted below the chart to show you how the resources are being used. At this point, the resources might contain big swings in usage, for example, J. Blow is required to work 16 hours a day for 3 days and then has no work at all for the other two. For most resources, their usage profile must be as flat as possible to minimize their cost, and that’s where resource levelling comes in.
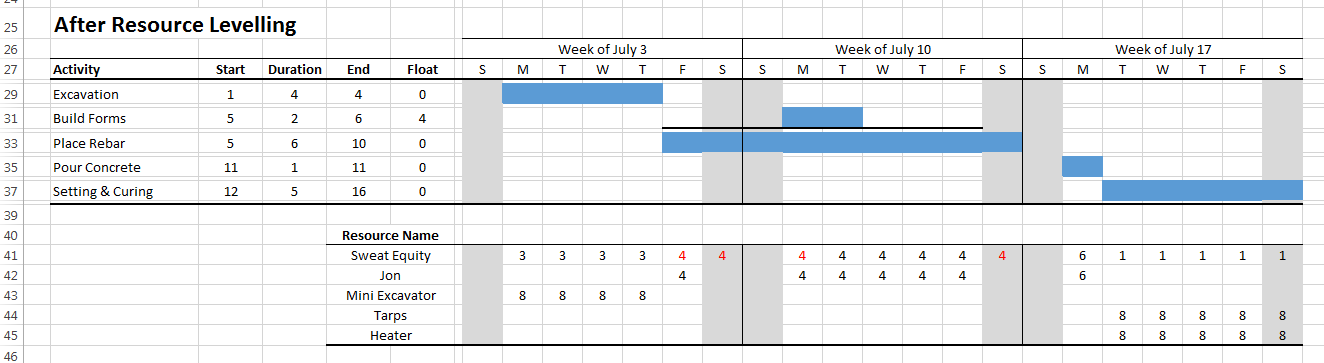
Resource Levelling
Unfortunately, none of us can escape the reality of limited resources. Resource levelling refers to the act of moving the tasks backwards and/or forwards within their floats in order to flatten the peaks and valleys of resource usage (labor, materials, and equipment). It is much better to use a person for 8 hours/day for two days than 16 hours one day and 2 hours the next.
The forward and backwards passes only tell you the float. Resource levelling determines where within the float to put the task.
During this step, each area where resource usage has unacceptable peaks and valleys is inspected and tasks are moved within their floats to flatten the resource usage profile. If the task is on the critical path and its start and end dates must change due to resources, the final completion date of the project must change.
Resources calendars which specify the availability of each resource are consulted to determine when the resources are available. In general, there are three possibilities:
- Keep the task duration constant and move the task forward or backward along its float. The resources simply move to the new place in the schedule.
- Increase the task duration within the float. This will spread out the resources, for example, reducing a laborer’s hours on a task from 4 hours to 2 hours per day might eliminate overtime, but increase the duration of the task. If that’s within the float, this is an acceptable solution.
- Change the task end date past the end of its float. This is the least desirable situation and it requires the rest of the schedule to be adjusted accordingly. But sometimes it is necessary. Many projects have been in a position where tasks have been started only to realize the resources aren’t available to finish on time. Adjust the schedule before it happens to you.
Items 1 and 2, where the finish date of the task does not change, are sometimes called Resource Smoothing instead of resource levelling.
Schedule Compression
Upon resource levelling you might have a completely functional schedule. But it is often desirable to shorten a task in order to lengthen another one, or to move up the overall completion date. For example, maybe Jon will be leaving for a tropical vacation and obtaining another laborer would incur significantly more time and expense. When you need to shorten a task’s duration, you have two options:
- Crashing. This involves adding resources to the task. Increasing Jon’s hours or getting the neighbor to help would be methods of crashing the schedule.
- Fast tracking. This involves performing tasks in parallel that are otherwise performed in sequence. Building concrete forms before the excavation is done would be a type of fast tracking. There is a risk of rework due to incorrect assumptions which must be made to account for incomplete predecessor tasks.
Concurrent with these two schedule compression techniques, there are a few bigger picture options:
- Change the scope. Eliminate non-essential tasks from the project. Remove small sub-tasks that do not add much value. Adopt the minimum viable project scope.
- Reduce quality. Remove features from the product, or change the quality specifications.
- Outsource. If you don’t have the capacity to perform the task on time, outsourcing it can allow the project to meet the schedule. But it comes at the cost of a lack of control of future schedule changes and potentially higher cost. Also the vendor might not have the same quality standards.
Schedule compression can be used when developing the schedule, but it is more often used during project execution when changes are happening and possibilities are being analyzed to determine an action plan.
External Criteria
Sometimes a project completion date is externally imposed on the project, for example when a stadium must be complete for the olympics. In this case the standard scheduling methods described above still apply, only an additional sequence of steps must be performed.
- Create schedule as normal using resources available.
- If the externally imposed completion date is later than the completion date, find the most likely tasks to be behind schedule and add to their duration. Alternatively, create a separate task called “contingency” which can be used to alter the schedule without consequence during the project.
- If the externally imposed completion date is earlier than the completion date, this is called negative float and you must make changes to complete the project on time. The project scope could be tightened (i.e. revert to minimum viable scope), or items removed that are considered non-essential. Each task needs to be scrutinized for the available schedule compression techniques outlined above.
Scheduling Software
Although spreadsheets can be used to build a professional, resource levelled schedule, a good project management software package makes the process much quicker. Project management software is highly dependent on the industry in which its being used, which makes sense due to the special attention that can be given to important features.
Microsoft Project is something of a standard in the project management industry, in the absence of anything else. Primavera P6 is popular in construction, and online project management suites are popular within Information Technology.
It is essential to determine what features the software has. It is not a safe assumption that all project management software contains all the features of professional project scheduling, like dependencies, floats, and critical paths. In particular, most online web-based alternatives are relatively primitive in their scheduling capabilities. If that’s all you need, then great, but if you are doing more sophisticated scheduling then consider Microsoft Project or an industry specific package.
Hopefully that provided a good overview of the critical path method. Drop us a note in the comments if you have anything to add.