Staying within budget and schedule is one of the project manager’s most important jobs. It is not an understatement to say that if you master this one thing, most other things will fall into place.
The secret to doing this well is called earned value management. It is one of the foundational processes of project management, as well as a central component of the Project Management Body of Knowledge (PMBOK Guide)
In project manager parlance, earned value management is a project control technique, that is, its purpose is to ensure that the project finishes within the schedule and budget, which are determined during the project planning stage.
Hence, earned value management is specific to these two variables:
- Budget
- Schedule
However, it touches upon several other areas of project management as well, such as resource management and scope control.
How to Implement Earned Value Management
You might have seen the formulas before, and even memorized them for the PMP exam. Kudos to you if you’ve done that. But the knowledge of how to implement earned value will render memorization unnecessary, since the formulas will flow naturally when you understand the underlying principles.
Firstly, the project must have a schedule. That is, you must have a target to aim for and a standard to measure progress against. This schedule must contain a listing of project tasks, and each task must have the following three things:
- Start date
- End date
- Budget
This table demonstrates the most basic information necessary to perform earned value management.
| Task | Start | End | Budget |
|---|---|---|---|
| Perform research | March 1 | April 30 | $20,000 |
| Write report | April 15 | May 30 | $10,000 |
| TOTAL | $30,000 | ||
| Table 1: The minimum project plan | |||
In project management lingo, this is called a Work Breakdown Structure (WBS).
At regular intervals, called status points, the earned value calculations are carried out and reported. This status period is usually one week because that period works for most large as well as small projects. However, you are free to choose whatever status points you like.
The Earned Value Management Calculations
At the status points, the project manager must do some simple calculations. They are not complicated and I will walk you through step by step. These calculations fall into three categories:
- Inputs
- Budget at Completion (BAC)
- Planned Value (PV)
- Earned Value (EV)
- Actual Cost (AC)
- Current Status
- Schedule Variance (SV)
- Schedule Performance Index (SPI)
- Cost Variance (CV)
- Cost Performance Index (CPI)
- Forecasting
- Estimate to Complete (ETC)
- Estimate at Completion (EAC)
- Variance at Completion (VAC)
- To-Complete Performance Index (TCPI)
Inputs
The first group are not so much calculations as they are data gathering. You are determining several things from your project:
- Budget at Completion (BAC)
- Planned Value (PV)
- Earned Value (EV)
- Actual Cost (AC)
Budget at Completion (BAC)
This is a great way to get started because it’s the easiest one. The Budget at Completion (BAC) is simply the task’s budget, which you have already determined during the planning phase.
We will simply rename the ‘Budget’ column ‘BAC’.
| Task | Start | End | BAC |
|---|---|---|---|
| Perform research | March 1 | April 30 | $20,000 |
| Write report | April 15 | May 30 | $10,000 |
| TOTAL | $30,000 | ||
| Table 2: The project budget is renamed BAC | |||
Planned Value (PV)
Planned Value, also known in oldies circles as the Budgeted Cost of Work Scheduled (BCWS), is the authorized, time-phased budget assigned to accomplish the work up to the point of analysis (usually today). It is the amount that the project is supposed to have completed up to the status point.
Let’s say it’s March 20 today. The planned percent complete is 40% based on the start and end dates. Therefore:
PV1 = 40% x $20,000 = $8,000.
PV2 = 0% x $10,000 = $0.
| Task | Start | End | BAC | PV |
|---|---|---|---|---|
| Perform research | March 1 | April 30 | $20,000 | $8,000 |
| Write report | April 15 | May 30 | $10,000 | $0 |
| TOTAL | $30,000 | $8,000 | ||
| Table 3: The Planned Value is added | ||||
Earned Value (EV)
The third input is called the Earned Value, also known in oldies circles as the Budgeted Cost of Work Performed (BCWP). It is the actual amount of work completed in terms of the task’s budget. This usually requires an estimate of percent complete, or parametric variables such as number of fenceposts pounded.
For our example, let’s say we have discussed progress with the team members and inspected the progress, and we think the task is actually 30% complete. We would write:
EV1 = 30% x $20,000 = $6,000.
EV2 = 0% x $10,000 = $0.
| Task | Start | End | BAC | PV | EV |
|---|---|---|---|---|---|
| Perform research | March 1 | April 30 | $20,000 | $8,000 | $6,000 |
| Write report | April 15 | May 30 | $10,000 | $0 | $0 |
| TOTAL | $30,000 | $8,000 | $6,000 | ||
| Table 4: The Earned Value is added | |||||
Actual Cost (AC)
Also known as the Actual Cost of Work Performed (ACWP), the AC is simply the cost to perform the work up to that status point. Most organizations track their costs quite well. If yours does not fall into this category, make sure you get project team members to submit receipts, or develop your own cost tracking mechanism.
In our example, let’s say we have examined the project receipts and concluded that the actual amount spent on the project so far is $5,000, all of it within the ‘Perform Research’ task.
Once again, we add a column to the table:
| Inputs | ||||||
|---|---|---|---|---|---|---|
| Task | Start | End | BAC | PV | EV | AC |
| Perform research | March 1 | April 30 | $20,000 | $8,000 | $6,000 | $5,000 |
| Write report | April 15 | May 30 | $10,000 | $0 | $0 | $0 |
| TOTAL | $30,000 | $8,000 | $6,000 | $5,000 | ||
| Table 5: The Actual Cost is added | ||||||
That concludes the first of the three categories (inputs). At this point, the table is pretty uninteresting, it tells you nothing new because all of the variables are obtained from project data. The next category is going to perform some basic calculations to tell you if the project is ahead or behind schedule, and over or under budget.
Current Status
Once we’ve gathered the project information, we will determine the current budget and schedule status at the current status point. Earned Value Management answers the following questions:
- How far ahead or behind schedule is the project?
- How far above or below budget is the project?
The four variables that will be calculated to answer these two questions are as follows:
- Schedule Variance (SV)
- Schedule Performance Index (SPI)
- Cost Variance (CV)
- Cost Performance Index (CPI)
Schedule Variance (SV)
The Schedule Variance is a measure of how far off schedule the project is. It takes into account all of the tasks, therefore some might be ahead and some might be behind. It expresses the result as a monetary value, which can be compared to the project budget.
The Schedule Variance is calculated individually per task, and summed to determine the overall project variance. The formula is:
- If SV < 0, the project is behind schedule
- If SV = 0, the project is right on schedule
- If SV > 0, the project is ahead of schedule
In other words, the higher the value, the better. Positive is good, negative is bad. You will find that this is a recurring theme in earned value calculations.
Schedule Performance Index (SPI)
The Schedule Performance Index is similar to the Schedule Variance. They are brother and sister, two peas in a pod. The only difference is that the SPI tells you how far ahead or behind schedule the project is in percentage terms, relative to the overall size of the project.
The formula is:
- If SPI < 1, the project is behind schedule
- If SPI = 1, the project is right on schedule
- If SPI > 1, the project is ahead of schedule
Like the SV, the higher the value, the better. Above 1.0 is good, below 1.0 is bad. The SPI is a percentage and the value 1.0 represents that 100% of the work expected at this point is complete. For example, an SPI of 1.2 means that the project is 20% ahead of schedule.
After the SV and SPI our table now looks like this:
| Inputs | ||||||||
|---|---|---|---|---|---|---|---|---|
| Task | Start | End | BAC | PV | EV | AC | SV | SPI |
| Perform research | March 1 | April 30 | $20,000 | $8,000 | $6,000 | $5,000 | -$2,000 | 0.75 |
| Write report | April 15 | May 30 | $10,000 | $0 | $0 | $0 | N/A | N/A |
| TOTAL | $30,000 | $8,000 | $6,000 | $5,000 | -$2,000 | 0.75 | ||
| Table 6: The Schedule Variance and Schedule Performance Index are added | ||||||||
Cost Variance (CV)
The Cost Variance is the equivalent to the Schedule Variance, but it tells you whether the project is over or under budget, instead of schedule. It also takes into account all of the tasks, therefore some tasks might over and some might be under budget, but the CV gives you the entire picture.
As with the SV, you calculate the CV per task, and sum it do determine the CV for the entire project. The formula is:
- If CV < 0, the project is over budget
- If CV = 0, the project is right on budget
- If CV > 0, the project is under budget
Once again, the higher the value, the better. Positive is good, negative is bad. For example, CV = $2,000 means the project is $2,000 under budget.
Cost Performance Index (CPI)
The Cost Performance Index and Cost Variance are also brother and sister, two peas in a pod. They both give you the cost status of the project, with the only exception being that the CPI gives you the percentage, that is relative, amount. The formula for CPI is:
- If CPI < 1, the project is over budget
- If CPI = 1, the project is right on budget
- If CPI > 1, the project is under budget
Once again the theme holds, the higher the value, the better. Above 1.0 is good, below 1.0 is bad. The CPI is a percentage, therefore the value 1.0 means that 100% of the budget expected at this point is complete. For example, a CPI of 1.3 means that the project is 30% under budget.
After the CV and CPI, our table looks like this:
| Inputs | Current Status | |||||||||
|---|---|---|---|---|---|---|---|---|---|---|
| Task | Start | End | BAC | PV | EV | AC | SV | SPI | CV | CPI |
| Perform research | March 1 | April 30 | $20,000 | $8,000 | $6,000 | $5,000 | -$2,000 | 0.75 | $1,000 | 1.20 |
| Write report | April 15 | May 30 | $10,000 | $0 | $0 | $0 | N/A | N/A | N/A | N/A |
| TOTAL | $30,000 | $8,000 | $6,000 | $5,000 | -$2,000 | 0.75 | $1,000 | 1.20 | ||
| Table 7: The Cost Variance and Cost Performance Index are added | ||||||||||
Forecasting
The four variables described above, SV, SPI, CV, and CPI, give you the current schedule and cost status of the project. That is, they tell you where the project is right now. But ask anyone and they will tell you the real value of the earned value method is in its forecasting ability. You can use the variables to tell you what the trend is, and where your project might end up if the current trends continue. Sound cool? Read on to see how the analysis works.
There are four earned value variables that allow you to forecast future project performance:
- Estimate at Completion (EAC)
- Estimate to Complete (ETC)
- Variance at Completion (VAC)
- To Complete Performance Index (TCPI)
Estimate at Completion (EAC)
One of the most critical numbers to the project manager is how much the final project cost will be. The Estimate at Completion (EAC) represents that amount. For example, if the original BAC (project budget) is $100,000, and the EAC is $110,000, the project is trending $10,000 over budget.
Hence, the EAC is one of the most used and recognizable of the earned value metrics.
However, because the EAC is a forecast into the future, it requires an assumption as to what the project performance will be like between now and then. There are essentially four methods of projecting project performance to the end of the project:
- If the project’s cost performance will not affect future performance, that is, the cost variance is one-time and future work will proceed at the planned rate:
EAC = AC + BAC – EV
- If the current cost variance is representative of future project performance:
EAC = BAC / CPI
- If both the cost and schedule variance will continue to affect the project:
EAC = AC + [(BAC – EV) / (CPI x SPI)]
- If the initial plan is no longer valid, a new estimate must be produced altogether:
EAC = AC + Bottom-up ETC
Estimate to Complete (ETC)
Estimate to Complete (ETC) is a calculation of the remaining funds needed to complete the project. It is the amount of money you need to have in the bank to finish the project starting from right now. Since running out of money is not very often a major consideration for most projects, this is not a very well used metric.
There are two possibilities:
- If the work is proceeding on plan:
ETC = EAC – AC
- If the work is not proceeding on plan, a new ETC must be produced:
ETC = Re-estimate
Variance at Completion (VAC)
Although the EAC is the core forecasting value, a common secondary concern is how far out the project is projected to be. Variance at Completion (VAC) is a calculation of the final projected cost variance (CV) at the end of the project.
It is calculated as follows:
- If VAC > 0, the project is expected to finish under budget
- If VAC = 0, the project is expected to finish on budget
- If VAC < 0, the project is expected to finish over budget
The VAC is more obvious in practice than on paper. For example if a project has a BAC (project budget) of $100,000 and the EAC (forecasted final project budget) is $110,000, it’s quite obvious that the project is trending $10,000 over budget (the VAC). Many project managers don’t even realize it has its own name.
To Complete Performance Index (TCPI)
The TCPI is a measure of the efficiency required to complete the project at its planned budget. Since the CPI measures the efficiency of the project to date, the TCPI measures the CPI necessary to make up for a shortfall.
For example, if a project has a CPI of 0.9, it is 10% over budget and will need a TCPI of 1.1 to finish on budget (if it was exactly half way complete). If the project was not exactly half way complete, the TCPI will skew accordingly.
There are two ways to calculate the TCPI:
- If the project budget will not be changed, that is, the target is still the original budget, the TCPI is calculated as follows:
TCPI = (BAC – EV) / (BAC – AC)
- If the target is to attain the EAC (the projected final project cost which was calculated in one of four ways), the formula is:
TCPI = (BAC – EV) / (EAC – AC)
- If TCPI > 1.0, the future efficiency of the project must be greater than the original plan
- If TCPI = 1.0, the future efficiency of the project must be the same as the original plan
- If TCPI < 1.0, the future efficiency of the project must be less than the original plan
For brevity, I have collapsed the first group of variables.
| Current Status | Forecast | |||||||||||
|---|---|---|---|---|---|---|---|---|---|---|---|---|
| Task | Start | End | BAC | SV | SPI | CV | CPI | EAC | ETC | VAC | TCPI | |
| Perform research | March 1 | April 30 | $20,000 | -$2000 | 0.75 | $1,000 | 1.20 | $19,000 | $14,000 | $1,000 | 0.93 | |
| Write report | April 15 | May 30 | $10,000 | N/A | N/A | N/A | N/A | $10,000 | $10,000 | $0 | N/A | |
| TOTAL | $30,000 | -$2,000 | 0.75 | $1,000 | 1.20 | $29,000 | $24,000 | $1,000 | 0.93 | |||
| Table 8: The Forecasting variables are added | ||||||||||||
Earned Value Reporting
Calculations have no value unless they’re reported to senior management, investors, or stakeholders. There are five ways to report earned value:
-
- Small Project Status Report
For the smallest projects, this report gives the reader a quick glimpse into the project’s budget and schedule status without requiring any more than a few minutes to produce.Small Project Status Report Date April 3 Project Budget $10,000 Schedule Variance -$1,000 Cost Variance -$1,500 Comments A one time purchase of supplies
has created the negative variances - Small Project Trend Report
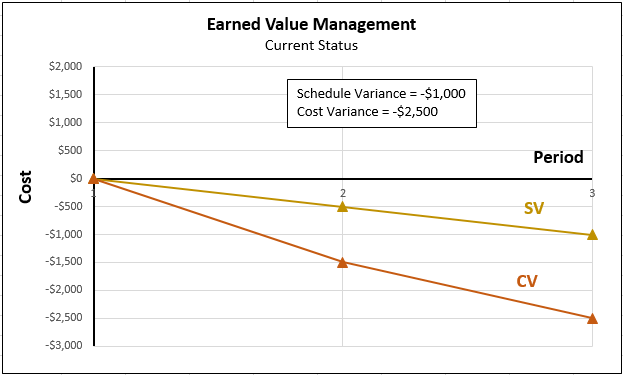
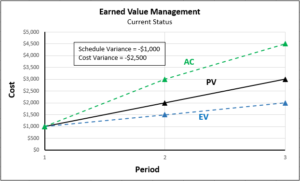
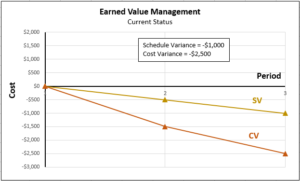
This report details the current status metrics for an audience that is sophisticated enough to interpret their meaning. It requires about 10 minutes to produce but shows how the project’s metrics have changed over time.Period Inputs Schedule Cost PV EV AC SV SPI CV CPI 1 $1,000 $1,000 $1,000 $0 1.0 $0 1.0 2 $2,000 $1,500 $3,000 -$500 0.90 -$1,500 0.85 3 $3,000 $2,000 $4,500 -$1,000 0.67 -$2,500 0.44 4 A chart can say the proverbial thousand words:
- Project Earned Value Report
This report includes all of the earned value metrics, and requires an audience that is sophisticated enough to know what they mean. It takes about half an hour to perform the full gamut of earned value calculations and report them (by hand), and it provides a complete statement to management.ID Name Start End BAC PV EV AC SV SPI CV CPI ETC EAC VAC TCPI 100 Set up Database Mar. 1 Mar. 10 $10,000 110 Acquire Server Mar. 1 Mar. 2 $1,500 120 Set up Data Structure Mar. 3 Mar. 3 $1,000 130 Move Data Mar. 4 Mar. 10 $7,500 200 Build Application Mar. 7 Mar. 20 $15,000 TOTAL $35,000 - Project Earned Value Trend Report
This report shows not just the individual earned value metrics, but the trends they have exhibited over time. Hence, it is an amazing snapshot of project performance over time.Period 1 Period 2 Period 3 Period 4 Period 5 BAC PV EV AC SV SPI CV CPI ETC VAC TCPI EAC Once again, a chart can say the proverbial thousand words and illustrate the trend much clearer than a table can.
- Large Project Earned Value Report
For large projects, a customized report is an important part of project communication and the stakeholders are usually highly sophisticated and interested in the report. The project manager is dedicated to the project full time and can produce an extensive report on a regular basis. The report contains discussion items for the causes of project variances and corrective actions implemented. This report is taken from the Practice Standard for Earned Value Management, a supplement to the PMBOK Guide produced by the Project Management Institute.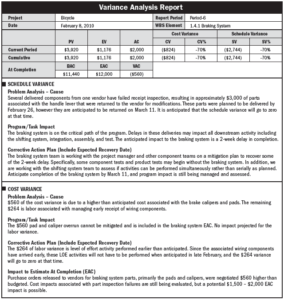
- Small Project Status Report