In yesterday’s post we outlined the critical path method which is one of the professional project manager’s techniques to ensuring project deadlines are met. Today we will walk through an example with a complete solution using MS Excel.
Our example project is to build a new driveway. We will be hiring our friend, Jon, who is a concrete worker, and we will rent an excavator for a few days which we will operate ourselves.
The project will be scheduled using professional project management techniques without project management software, in other words, with MS Excel.
Critical path analysis requires the following 6 steps:
- Divide the project into tasks
- Estimate tasks
- Create the network diagram
- Draw initial Gantt (bar) chart
- Perform resource levelling
- Compress the schedule (if necessary)
Step 1: Divide the Project into Tasks
The first step is to divide the project into tasks, also known as activities. Ideally, each task should have one responsible party and be easy to estimate. For example, excavation and pouring concrete might have separate responsible parties (contractors, etc.) and should therefore be separate tasks. Here’s the task list I came up with:
| Task List | ||
| Task No. | Name | Predecessors |
|---|---|---|
| 110 | Excavation | |
| 120 | Build Forms | 110 |
| 130 | Place Rebar | 110 |
| 210 | Pour Concrete | 120, 130 |
| 310 | Setting & Curing | 210 |
| 320 | Strip Forms | 310 |
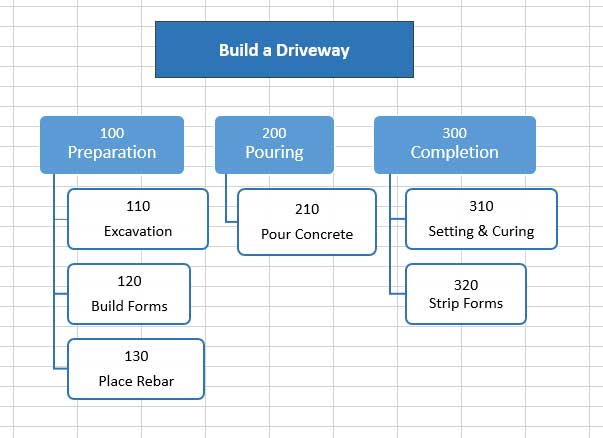
A graphical style is sometimes helpful, but not a necessity. This one was done in 5 minutes with MS Excel using the SmartArt feature:
The task list can also contain “activity attributes,” which identify meta-level information about the task. For example, there could be a column called “Subcontractor”:
| Task List | |||
| Task No. | Name | Dependencies | Subcontractor |
|---|---|---|---|
| 110 | Excavation | ||
| 120 | Build Forms | 110 | Jon’s Concrete |
| 130 | Place Rebar | 110 | Jon’s Concrete |
| 210 | Pour Concrete | 120, 130 | Jon’s Concrete |
| 310 | Setting & Curing | 210 | |
| 320 | Strip Forms | 310 | |
Step 2: Estimate Tasks
Let’s get into the meat & potatoes. Once the project has been divided into tasks, each task must be estimated. Two things need to be determined:
- Task Resources
- Task Duration
I’ll show you the result and then explain it. Here are the final estimate tables. Each task gets one table:
| 110 Excavation | ||
|---|---|---|
| Type | Average Use | Total |
| Mini-excavator | 4 days @ $450/day | $1,800 |
| Sweat Equity | 12 hours @ $0/hr | $0 |
| TOTAL | $1,800 | |
| Duration | 4 days | |
| 120 Build Forms | ||
|---|---|---|
| Type | Average Use | Total |
| Lumber | Lump Sum | $100 |
| Sweat Equity | 8 hours @ $0/hr | $0 |
| TOTAL | $100 | |
| Duration | 2 days | |
| 130 Place Rebar | ||
|---|---|---|
| Type | Average Use | Total |
| Rebar | Lump Sum | $200 |
| Jon | 24 hours @ $25/hr | $600 |
| Sweat Equity | 24 hours @ $0/hr | $0 |
| TOTAL | $800 | |
| Duration | 6 days | |
| 210 Pour Concrete | ||
|---|---|---|
| Type | Average Use | Total |
| Concrete | 12 yd3 @ $45/yd3 | $540 |
| Jon | 6 hours @ $25/hr | $150 |
| Sweat Equity | 6 hours @ $0/hr | $0 |
| TOTAL | $690 | |
| Duration | 1 day | |
| 310 Setting & Curing | ||
|---|---|---|
| Type | Average Use | Total |
| Tarps | Lumps Sum | $50 |
| Heater | 4 days @ $50/day | $200 |
| Sweat Equity | 5 hours @ $0/hr | $0 |
| TOTAL | $250 | |
| Duration | 5 days | |
| 320 Strip Forms | ||
|---|---|---|
| Type | Average Use | Total |
| Sweat Equity | 5 hours @ $0/hr | $0 |
| TOTAL | $0 | |
| Duration | 5 days | |
The overall project budget is therefore:
| ID | Task | Budget |
|---|---|---|
| 110 | Excavation | $1,800 |
| 120 | Build Forms | $100 |
| 130 | Place Rebar | $800 |
| 210 | Pour Concrete | $690 |
| 310 | Setting & Curing | $250 |
| 320 | Strip Forms | $0 |
| TOTAL | $3,640 | |
Here’s a checklist for resources:
- Labor. Even if the cost to the project is $0, such as when a project member is borrowed from a technical department (or you’re doing it yourself, like above), they should be entered as resources because their availability can affect the project deadlines.
- Equipment. Often equipment is sourced at hourly rates, or internally owned equipment has an hourly rate applied to it.
- Materials. If the project needs to purchase materials, their cost is often easy to estimate from published rates, or quotes can be obtained from suppliers.
- Fixed cost items, such as a subcontractor. This is a double edged sword, as a subcontractor’s costs are fixed, but they take responsibility for the schedule and quality of work away from you. Also, you must know the fine print, or else the costs might not nearly be as “fixed” as you think.
A note of caution. It is not only important to know what resources you need, but what their minimum specifications are. For example, you might know you need a crane, but how big of a crane? (I’ve seen the wrong size crane arrive at a site – I’m sure that cost the project some monopoly money). It’s not always so obvious though, so make sure your resources are up to the task.
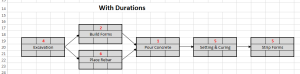
Step 3: Create the Network Diagram
Since we’re not using project management software for this exercise, this network diagram will be produced with MS Excel. Here is the original network, which is taken solely from the task list, above.

The Critical Path is defined as the longest path through the network, which means it defines the minimum completion date of the project. A four step process is employed which determines the critical path, as well as the floats of non-critical path items.
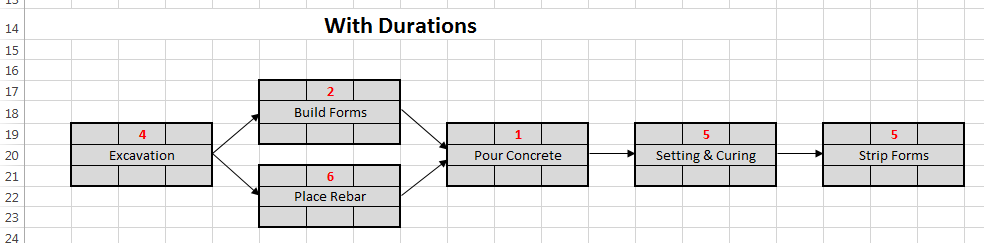
- Enter durations for all activities (previously calculated).
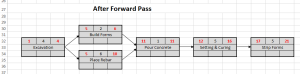
- Perform a Forward Pass, which identifies the Early Start (ES) and Early Finish (EF) dates for each task. These are entered into the top corners of the boxes, respectively. Starting with the first task, ES = 1. Then, EF = ES + Duration – 1. Note that both dates are inclusive to the task duration so the EF always requires the subtraction of 1 day. When passing through two parallel tasks, the highest EF is passed forward.
- Perform a Backward Pass, which identifies the Late Start (LS) and Late Finish (LF) dates for each task. These are entered into the bottom corners of the boxes, respectively. Starting with the last task, LF = EF. Then, EF = LF – Duration + 1. When passing through two parallel tasks, the lowest LS is passed forward.
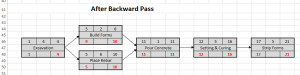
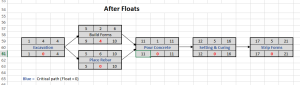
- Calculate float for each task. Float = LS – ES.

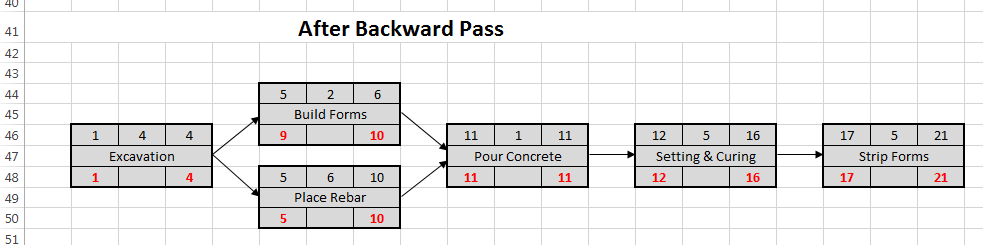
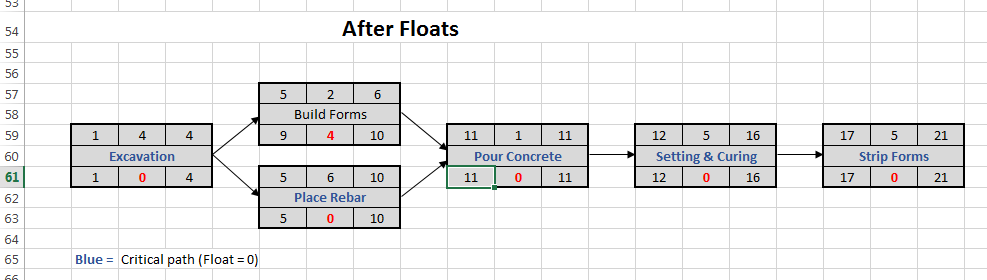
The project completion date was determined by the forward pass. It is the EF (top right corner) of the final task, or Day 21.
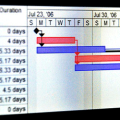
Step 4: Draw Initial Gantt (bar) Chart
To complete the scheduling process, a horizontal bar chart called a Gantt Chart is created. This can be done in MS Excel as well although you need to have a good working knowledge of it. It is the nicest, cleanest way to show the schedule. It also allows for the final step in the process, which is resource levelling. Here is the schedule:
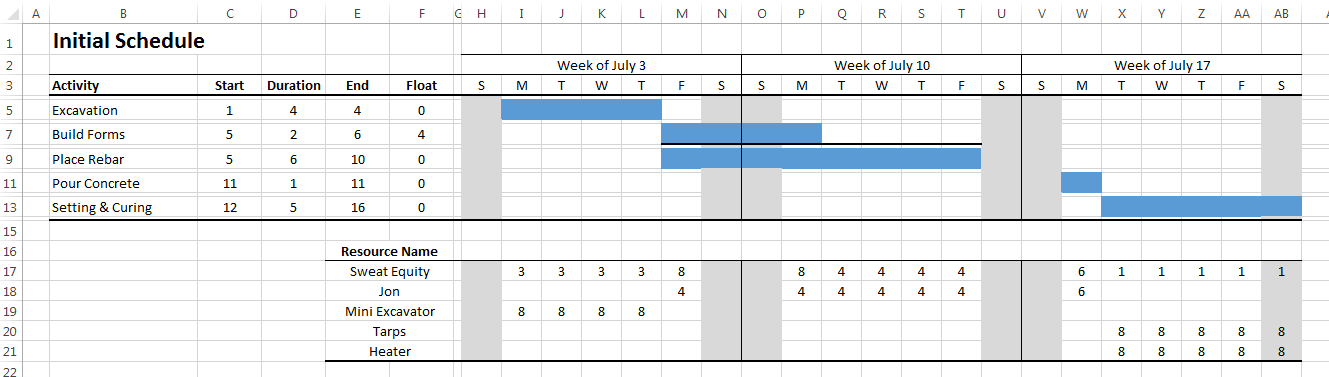 The tasks are plotted on their ES dates, in other words as far as possible to the left. At this point it is a coincidence if the resources do not contain spikes such as 16 hours of Jon’s time one day and 0 hours the next. Therefore, we proceed to the next step called Resource Levelling.
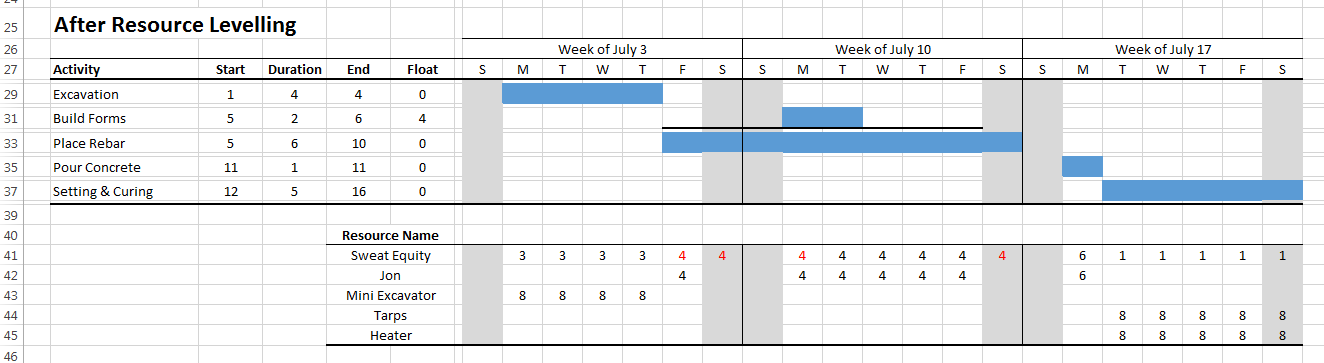
Step 5: Resource Levelling
In week 1, you are needed for 8 hours on friday, and 8 hours the following monday. Since you have a full time job you are not available for 8 hours on those days. In project management terminology, your resource calendar shows that you are not available. Therefore, we need to move things around.
The gantt chart makes it clear that the building of forms (task 120) cannot start until the following week. Also, you will need to work place rebar on saturday to avoid more than 4 hours of work per day. Thus, we will move task 120, Build Forms, ahead by 3 days and ensure that both saturdays have 4 hours of work on task 130, Place Rebar.
When there are unacceptable spikes in resources, you have three options:
- Keep the task duration constant and move the task forward or backward along its float. The resources simply move to the new place in the schedule.
- Increase the task duration within the float. This will spread out the resources, for example, reducing a laborers hours on a task from 4 hours to 2 hours per day might eliminate overtime, but increase the duration of the task. If that’s within the float, this is an acceptable solution.
- Change the task end date past the end of its float. This is the least desirable situation and it requires the rest of the schedule to be adjusted accordingly. But sometimes it is necessary.
Step 6: Schedule Compression
The last step applies only if you have to shorten the schedule. Let’s say Jon decides he is leaving for a tropical vacation and the concrete must be poured on the friday prior to the regularly scheduled monday.
In this case, you have two options for each task:
- Crashing. This involves adding resources to the task. Increasing Jon’s hours or getting the neighbor to help would be methods of crashing the schedule.
- Fast tracking. This involves performing tasks in parallel that are otherwise performed in sequence. Building concrete forms before the excavation is done would be a type of fast tracking. There is a risk of rework due to incorrect assumptions which must be made to account for incomplete predecessor tasks.
You also have three options which involve the overall project:
- Change the scope. Eliminate non-essential tasks from the project. Maybe you can place less rebar.
- Reduce quality. Rent the excavator for one less day and don’t make the excavation lines as smooth.
- Outsource. Hire a laborer to complete tasks 120, Build Forms, or 130, Place Rebar. This replaces the resource Sweat Equity (i.e. you don’t have to do it) and changes the durations of the tasks.
Good luck with your schedule. Drop us a note in the comments to let us know how this process works for you!