Total Float is a concept within the Critical Path Method which tells the project manager how much a task can be delayed without impacting the project completion date. Float is the final product of the project network diagram. The network diagram is used to determine two things:
- Tasks which are on the critical path
- Float (total) of each task
The Two Types of Float
There are two types of float:
- Total Float: The amount that a task can move without affecting the final project completion date.
Total Float = LF – EFTotal Float = LS – ES
Both of these formulas produce the same result
- Free Float: The amount that a task can move without affecting other tasks.
Free Float = ES2 – EF1
The reason there are two types of float is because a delayed task is probably not a concern if the next task is able to “absorb” the delay. Future tasks are delayed in a domino effect, but unless the delay reaches the total float, the overall project completion date is unaffected.
That being said, traditional network diagramming techniques use the total float, so project management is normally based on the total float, while free float is not used unless it is necessary.
How to Calculate Total Float
Total float is calculated using a network diagram. Although there are a few steps, network diagrams are not very difficult to produce and a simple step by step process is not hard to remember.
Step 1: Divide the Project into Tasks
The project is subdivided into its constituent tasks. This is usually called a Work Breakdown Structure (WBS), although the Project Management Body of Knowledge (PMBOK) differentiates between a WBS and an Activity List. The WBS is actually a deliverable-oriented subdivision of the work, focusing on the project deliverables rather than strictly tasks to be completed.
Make sure each task represents one interrelated unit of work. If you have too many tasks, it becomes burdensome and micromanaged. If you have too few tasks, there is little point in creating a network diagram because large, unrelated work is managed within the same task.
Step 2: Determine the Network
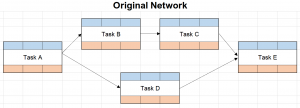
Once the tasks are chosen, the network is created by way of task dependencies, that is, each task’s predecessor tasks are determined. For example,
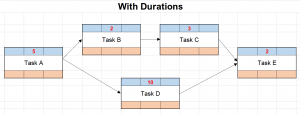
Step 3: Enter Task Durations
The task durations are an integral step in the schedule and they must be estimated accurately. Once the task durations are known, they are entered into the top, middle box.
Once the task durations are entered, it’s time to proceed to the forward pass. I’ll walk you through this step by step.
Step 4: Perform Forward Pass
The purpose of the forward pass is to determine the Early Start (top left box) dates, usually abbreviated ES, and the Early Finish (top right box) dates, usually abbreviated EF, for each task. These are defined as the earliest dates that the task can start.
The grand result of the forward pass is the completion date of the project, which is the EF (top right box) of the final task.
The step by step instructions are:
- Enter a “1” for the ES (top left) of the first task. That means it starts on day 1.
- Calculate the EF of the first task.
EF = ES + Duration – 1
The reason you have to subtract one is because the task start and end days are inclusive of the duration. For example, if you will be working on a task from days 1 – 5, that is a duration of 5 days, because days 1 and 5 are both included in the task duration.
- Calculate the ES of the next task.
ES2 = EF1 + 1
- Simply add one, because the next task simply starts on the day after the previous one completes.
- If moving from one task to two (or more), both tasks get the same ES, that is, they both start the day after the previous task.
- However, when there are two (or more) tasks that merge back into one, choose the highest LS.
- Proceed through all of the tasks in this fashion. The forward pass in our example looks like this:
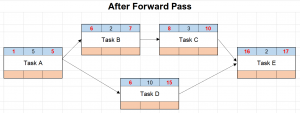 In this example, the project completion date is on day 17.
Step 5: Perform Backward Pass
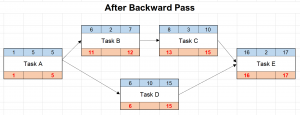
The purpose of the backward pass is to determine the Late Start, LS, (bottom left box) dates and Late Finish, LF, (bottom right box) dates for each task. These are defined as the earliest date that the task can finish, and the latest date that the task can finish, without affecting the completion date of the project.
To perform the backward pass, do the following step by step procedure.
- For the last task, enter LF = EF. That is, the bottom right box equals the top right box. This is the completion date of the project.
- Calculate the LS of the last task.
LS = LF – Duration + 1
- Calculate the LF of the previous task.
LF2 = LS1 – 1
- Once again, simply subtract one because the latest possible finish of a task without affecting the next task is simply the previous day.
- If moving from one task to two (or more), both tasks get the same LF.
- When two (or more) tasks merge back into one, choose the lowest LS.
- Proceed through all of the tasks until you get back to the first one. The backward pass in our example looks like this:
 Step 6: Determine Task Floats
Finally, we’re getting there. The Total Float is simply the bottom boxes minus the top boxes. It doesn’t matter whether the left or right side is used, the result will be the same.
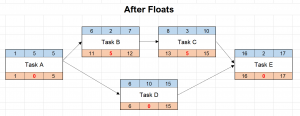 A few conclusions from the example:
- Tasks A, D, and E have zero float therefore they are on the critical path. This means if they are late, the overall completion date of the project will be late by the same amount. Thus, they deserve an appropriate amount of the project manager’s attention.
- The two tasks on the upper branch of the diagram, Tasks B and C, are shorter (2 days and 3 days, respectively) than Task D on the lower branch (10 days), therefore they can move by five days during the time Task D is being carried out.
The final network diagram looks like this:
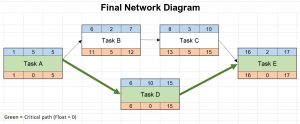 The Network Diagram uses Total Float
The float calculated on the network diagram is total float, not free float. This means that the float is for that branch of the diagram, not the individual task. For example, if Task A is delayed by 5 days, it has gobbled up Task C’s float as well.
