
Once the project has been divided into activities and resources assigned to those activities, the next step is to determine the activity durations. These durations are used to construct the project schedule.
Like the tiny O-rings that brought down the space shuttle Challenger, one small underestimation can result in a chain reaction that the project can’t recover from. Therefore, project planning needs to make sure that enough time is assigned to each task.
The PMBOK
The PMBOK reference is the process called “Estimate Activity Durations” which is part of the Project Time Management knowledge area. Like the other five processes involved in developing a project schedule, it falls within the planning process group.
PMBOK, 5th Edition, Section 6.5, “Estimate Activity Durations”
Estimate Activity Durations is the process of estimating the number of work periods needed to complete individual activities with estimated resources. The key benefit of this process is that it provides the amount of time each activity will take to complete, which is a major input into the Develop Schedule process.
The Inputs, Tools & Techniques, and Outputs are:
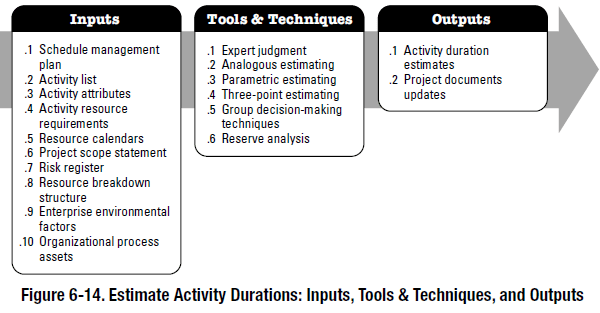
There are three ways to estimate an activity duration:
- Analogous Estimating
- Parametric Estimating
- Three point Estimating
Analogous Estimating
As the name suggests, this is when you make an analogy to the same, or similar, activity that has been performed before. This is the best source of information because actual work completed is extremely reliable, even if it needs adjustments. In fact, many organizations have similar projects, and this is the natural starting point. Here is a checklist of potential adjustments:
- The activity is bigger or smaller than the last one.
In this case, scale the duration up or down by the appropriate amount. For example, the log house has slightly more square footage, or the sidewalk is longer, or several more windows have been added. This might sound obvious but it’s never the big, obvious things that cause problems for project managers. You have to make sure you include enough contingencies for the little things. - The activity needs specialty products or services that the previous one didn’t.
In this case, add in the appropriate products and services and proceed as usual. There is usually a high potential for project overruns by missing a specialty item. For example, the slightly bigger roof trusses might require the next larger size of crane. Or the foundation requires removal of rock instead of clay. - The activity is for a slightly different end product.
In this case, determine the difference in materials and/or workmanship and figure out the difference in resources, cost, and time. For example, you could calculate from the plans that the log home requires 20% more timber than the previous one. Then you could estimate that the Wood Work task will take 20% more time.
One of the most problematic issues with analogous estimating is that it’s only as reliable as actual data the estimate is being taken from. Often you need to have been the project manager of the previous project, or at least close enough to it to know what happened and how it went. Say, for example the crane broke down and spent four days on site instead of two, you would not need to necessarily account for that in the new estimate. But it’s rarely obvious that something like that happened.
Also, the productivity of the work is an important consideration. An experienced laborer has higher productivity than a less experienced one. For knowledge workers such as engineers, adding more of them sometimes slows the production and decision making process down instead of speeding it up. Thus, changing resources from project to project might not result in an apples-to-apples comparison.
Parametric Estimating
A second common method for estimating activity durations requires that the work be drilled down into a unit cost, for example per square foot of log home. Here are some examples:
- Total construction time per square foot of log home.
- Pouring time per cubic yard of concrete.
- Installation time of carpet per square foot.
In the construction industry almost everything is done this way, from the engineering time down to the construction materials. If the log home company kept track of the construction time, especially for the individual task of Wood Work together with the square footage of the home, they could eventually arrive at a pretty good parametric estimate for all of the activity durations. In fact, a parametric estimate of the entire project would serve as an excellent guide for the entire business (determine the cost or duration per square foot of home).
If your company has many similar projects, you need to make sure these parametric estimates are available and up to date.
Sometimes a parametric value includes a fixed component, for example doors and windows which require a fixed time for an installer to come to the site and so forth. In this case the fixed items can be separated out and added to the overall parametric estimate.
Three-point Estimating
In this method, the estimator determines three numbers:
- Optimistic
- Most Likely
- Pessimistic
The second, “Most Likely” is the average of what the activity duration would be if performed many times, in other words the normal estimate using other methods. The other two represent the upper and lower bounds that you are not likely to exceed.
To do this numerically you would assign a confidence interval for the upper and lower bounds (optimistic and pessimistic values), such as 90%. Many textbooks use 99% or some other value, the methodology varies. But if you have ten previous projects to consult from and can determine what value 1 out of 10 projects exceeded, you can run with that.
Generally one of two distributions is used. The triangular distribution is simply an average of the three estimates and the beta distribution is a bit tighter.
| Triangular (average) distribution | Beta distribution |
|---|---|
| te = (a + m + b) / 3 | te = (a + 4m + b) / 6 |
Where:
- te = Expected duration
- a = Optimistic
- m = Most likely
- b = Pessimistic
The triangular distribution will skew the results to the value which is farther away from the Most Likely value. The beta distribution is tighter, that is, the result will be closer to the Most Likely value. I don’t believe there’s any more rocket science involved in this than that. You simply have to decide how tight to the Most Likely value you want to be.
For example, let’s say the expected duration of the task Wood Work is 18 days (m = 18), and you figure there is a significant potential for delays. The Optimistic estimate is 15 days (a = 15), but the Pessimistic estimate is 33 days (b = 33). The beta distribution yields:
te = (15 + 4 x 18 + 33) / 6 = 20 days
The triangular distribution yields:
te = (15 + 18 + 33) / 3 = 22 days
Which one do you choose? If the potential for 33 days looms large and has a high likelihood of occurence, you could use 22 days. If the likelihood is remote, you could use 20 days. It can seem like picking a random number, but later when things go wrong and you need to produce justification for choosing the activity durations you did, using one of these methods ensures there is justification for your actions. And it’s the proper project management procedure.
But let’s go even further. Let’s say we choose 20 days. What are the numerical odds of exceeding those 20 days?
The standard deviation of the distribution is:
σte = (b – a) / 6
If you add up all of the durations (∑m) and standard deviations (∑σ) for each task, you will have the total project duration as well as its standard deviation. You can draw the following conclusions from this:
- The confidence level in one standard deviation, i.e. M ± σ is about 68%.
- The confidence level in two standard deviations, i.e. M ± σ is about 95%.
- The confidence level in two standard deviations, i.e. M ± σ is about 99.7%.
In the example above, for the Wood work task the standard deviation is (33 – 15) / 6 = 3.0. Therefore, the task duration is:
- 20 days is the official estimate.
- 23 days with 68% confidence.
- 26 days with 95% confidence.
- 29 days with 99.7% confidence.
Do you think the boss would love this?
Just don’t be fooled by fancy statistics that make the conclusion sound more reliable than the input data. Like everything, garbage in = garbage out.
Expert Judgment
Professional estimators will tell you that in spite of all the techniques in the book a technical expert will be the best resource you could ever have. They could, in fact be the only resource you need. Technical experts are notoriously busy because their expertise gets used on many projects. But if you have access to one, whether inside the company or out, you should find a way to use them.
But what if a technical expert contradicts the other methods? For example, let’s say you’re installing carpet and your carpet installer tells you a certain project will take 4 days, but past experience (analagous) is telling your it will take 10 days. How valuable is the expert’s opinion then? It is difficult to give good advice that applies to all situations. You must simply weigh the two methods against each other, considering the underlying data of each method. For example, maybe this carpet installer frequently underestimates duration, or the past experience estimates are skewed by a certain piece of data.
Project management itself does not exist independently of the technical expertise inherent in the project. That is, the project manager or management team must be at least passingly familiar with the technical aspects of the work or the project has little chance of success.
Consult the Resource Calendar
To ensure that the duration of an activity is accurate, a resource calendar must be consulted. Each resource (human, equipment, tools, etc.) has a resource calendar whose purpose is to document when the resource is available to that project. For example, “Bob is at jobsite X from Sep. 1 to Sep. 30.” Obviously, a new project being planned cannot use this worker at that time (unless arrangements are made with the other project manager, I suppose).
The exact format of the resource calendar is irrelevant. It can be as simple as a listing of workers’ availability, or it can be a calendar within project management software that tracks employees’ schedules.
Example Project
To build our log home, we would inspect each resource calendar, use one of the four estimating techniques, and determine the amount of time required for each activity.
| Task ID | Name | Durations | Cost |
|---|---|---|---|
| 110 | Excavation | 6 days | $5,850 |
| 120 | Pour Foundation | 10 days | $4,700 |
| 210 | Wood work | 20 days | $60,850 |
| 310 | Electrical & Plumbing | 10 days | $20,260 |
| 320 | Flooring | 8 days | $18,760 |
| 330 | Finishing | 12 days | $16,760 |
| 410 | Landscaping | 14 days | $7,620 |
| TOTAL | 80 days | $134,800 | |
The total of 80 days is a great starting point, but it will still change.
It will decrease, because in the next step (schedule development) we will prioritize the tasks, putting some of them in parallel with others and smoothing resource usage to create the most efficient schedule.