If there’s one part of project management that’s bigger than all the rest, it’s project scheduling. Since a project is a temporary endeavor with a defined beginning and end, defining when that end takes place and making sure it finishes on time are extremely important to any project, large or small.
Professional project managers look at the schedule every day and obsess about staying on track.
In the Project Management Body of Knowledge (PMBOK), the 3rd out of ten knowledge areas is called Project Time Management. There are 7 processes within this knowledge area, and six of the seven occur within the planning process group. This article focuses on these six processes, which result in the creation of a professional project schedule.
PMBOK, 5th Edition, Section 6, “Project Time Management”
Project Time Management includes the processes required to manage the timely completion of the project.
The six processes within the Project Time Management knowledge area that are related to project scheduling are:
- Plan Schedule Management
- Define Activities
- Sequence Activities
- Estimate Activity Resources
- Estimate Activity Durations
- Develop Schedule
These six processes are performed in chronological order and represent the 6-step process in developing a project schedule.
Step 1: Plan Schedule Management
Before we begin, we must define certain aspects of the schedule management process.
PMBOK, 5th Edition, Section 6.1, “Plan Schedule Management”
Plan Schedule Management is the process of establishing the policies, procedures, and documentation for planning, developing, managing, executing and controlling the project schedule. The key benefit of this process is that it provides guidance and direction on how the project schedule will be managed throughout the project.
Answer the following questions:
- What size of contingency will be incorporated into each task?
- Are there any resources that have a major effect on the schedule (like for example the availability of a pile driver)?
- Are there any major task dependencies the project depends on, such as completing the foundation before the framing can start?
- What organizational procedures must be followed that will affect the schedule?
Step 2: Define Activities
Dividing the project into tasks (aka activities) is the first step in project scheduling.
PMBOK, 5th Edition, Section 6.2, “Define Activities”
Define Activities is the process of identifying and documenting the specific actions to be performed to produce the project deliverables. The key benefit of this process is to break down work packages into activities that provide a basis for estimating, scheduling, executing, monitoring and controlling the project work.
The format of the task list is irrelevant, but unless there is a reason to produce something more fancy it should consist of a simple list of tasks.
Let’s say you are a project manager for a firm that builds log houses. You have a new project to build a log house for the newly elected CEO of the Project Management Institute. You will hire an excavator and a bobcat but in-house personnel will build the foundation and do the landscaping, as well as the log house itself. Here’s a hypothetical task list.
| Task List | |
|---|---|
| Task ID | Name |
| 110 | Excavation |
| 120 | Pour Foundation |
| 210 | Wood work |
| 310 | Electrical & Plumbing |
| 320 | Flooring |
| 330 | Finishing |
| 410 | Landscaping |
The graphical view helps you visualize it to make sure it’s all there:
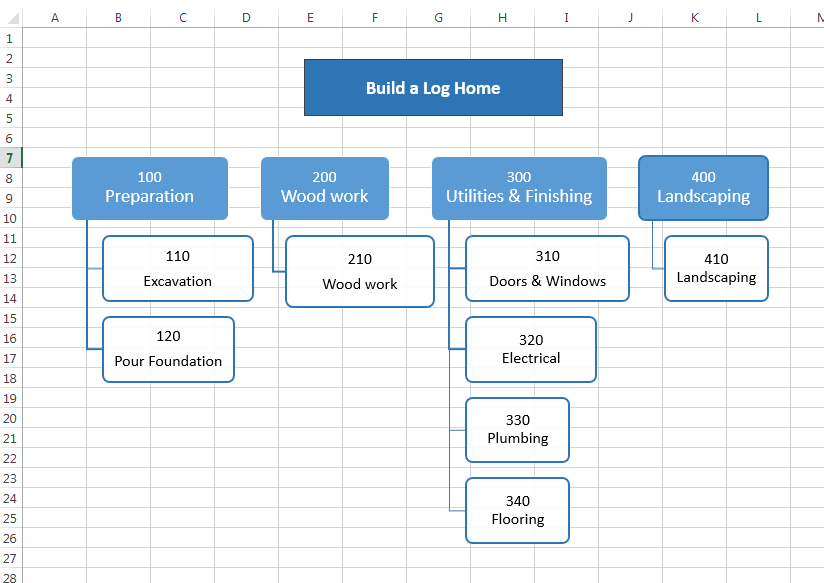
At this point the goal is simply to make sure it’s all there. Believe me, if you missed something it will show up later. But there are a few rules of thumb for determining the task list:
- Make sure it can be reliably estimated. The tasks should be broken down to a point where a reliable estimate can be produced. If you are still unsure about the cost and/or duration of the task, consider breaking it down further.
- Base it on Deliverables. Each deliverable should have a clearly defined task, or set of tasks, in place to produce it.
- Have only one Responsible Party. When you have multiple people and/or organizations responsible for the completion of a task, it is difficult to control and manage. In fact, I’ve committed this sin with the task Electrical & Plumbing, but often these are very well understood tasks and not likely to have major fluctuations.
- Match tasks to cost accounts. Maybe your organization has predefined cost accounts, such as “Wood work”, or “Flooring” that should be used.
- Make it measurable. It should be easy to put a percent complete value on a task at any time, but on time (schedule) progress and budget progress. If this is not easy to do, maybe it should be broken down further.
There is no correct length to a task, but if you have more than 10 tasks per phase it becomes difficult to manage and a third (or fourth) level should be created. A common yardstick is the 8/80 rule, which states that a task should be between 8 and 80 man-hours. Shorter than this will aggravate your project team as you micromanagement their daily work, and longer than this makes it difficult to accurately assign completion progress.
Step 3: Sequence Activities
After the project has been divided into tasks the relationships between them must be determined. Most of the time a task starts when the previous one finishes, but not all the time.
PMBOK, 5th Edition, Section 6.3, “Sequence Activities”
Sequence Activities is the process of identifying and documenting relationships among the project activities. The key benefit of this process is that it defines the logical sequence of work to obtain the greates efficiency given all project constraints.
There are, in fact, four types of dependencies:
- Finish to Start (FS): This is the most common dependency. When tasks A and B have an “FS relationship,” task B cannot start until task A finishes.
- Finish to Finish (FF): When tasks A and B have an FF relationship, task B cannot finish until task A finishes.
- Start to Start (SS): When tasks A and B have an SS relationship, task B cannot start until task A starts.
- Start to Finish (SF): When tasks A and B have an SF relationship, task B cannot finish until task A starts.
On top of this, you can specify an offset from the start or finish point of a task, called a lead or lag.
- Lead: The amount of time whereby a successor activity can be advanced with respect to a predecessor activity. For example, if tasks A and B have an FS relationship with a lead of 5 days, task B cannot start until 5 days after task A has finished.
- Lag: The amount of time whereby a successor activity will be delayed with respect to a predecessor activity. For example, if tasks A and B have an FS relationship with a lag of 5 days, task B cannot start until 5 days before task A has finished.
Leads and lags are the inverse of each other, similar to height and depth. They both have units of time, and most project management software requires the specification of lead times as negative lags for clarity.
Specifying dependencies is not mandatory, and in fact they will introduce an unnecessary layer of complexity in small projects unless you are using sophisticated project scheduling software. In our example we will use only FS relationships. A column is added to the table, like this.
| Task List | ||
|---|---|---|
| Task ID | Name | Dependencies (FS relationship) |
| 110 | Excavation | |
| 120 | Pour Foundation | 110 |
| 210 | Wood work | 120 |
| 310 | Electrical & Plumbing | 210 |
| 320 | Flooring | 210 |
| 330 | Finishing | 210, 310 |
| 410 | Landscaping | 120 |
Step 4: Estimate Activity Resources
PMBOK, 5th Edition, Section 6.4, “Estimate Activity Resources”
Estimate Activity Resources is the process of estimating the type and quantities of material, human resources, equipment, or supplies required to perform each activity. The key benefit of this process is that it identifies the type, quantity, and characteristics of resources required to complete the activity which allows more accurate cost and duration estimates.
At this stage each task on the task list is scrutinized. There are four major types of resources:
- Labor
- Tools and equipment
- Facilities
- Fixed cost items like subcontractors, etc.
You can also include financing costs, contingencies, overtime pay, and many other things, but these are the major items.
To build our log house we need to look at each individual task and determine the resources that are required. We would build a table that looks something like this:
| 110 – Excavation | ||
|---|---|---|
| Type | Average Use | Total |
| Excavation Contractor | 30 hrs @ $180/hr | $5,400 |
| Bob | 10 hrs @ $45/hr | $450 |
| TOTAL | $5,850 | |
If you need more complexity, like contingencies, financing, and so forth, start with this table and add the components you need. The other tasks for the log house might look like this:
| 120 – Pour Foundation | ||
|---|---|---|
| Type | Average Use | Total |
| Concrete Forms | Lump Sum | $1,000 |
| Bob | 20 hrs @ $45/hr | $900 |
| Mark | 40 hrs @ $35/hr | $1,400 |
| Bill | 40 hrs @ $35/hr | $1,400 |
| TOTAL | $4,700 | |
| 210 – Wood work | ||
|---|---|---|
| Type | Average Use | Total |
| Timber | 1,200 m @ $35/m | $42,000 |
| Crane | 2 days @ $70/day | $1,400 |
| Other Supplies | Lump Sum | $5,000 |
| Bob | 90 hours @ $45/hr | $4,050 |
| Mark | 120 hrs @ $35/hr | $4,200 |
| Bill | 120 hrs @ $35/hr | $4,200 |
| TOTAL | $60,850 | |
| 310 – Electrical & Plumbing | ||
|---|---|---|
| Type | Average Use | Total |
| Electrical Contractor | Lump Sum | $8,700 |
| Plumbing Contractor | Lump Sum | $11,200 |
| Bob | 16 hrs @ $45/hr | $360 |
| TOTAL | $20,260 | |
| 320 – Flooring | ||
|---|---|---|
| Type | Average Use | Total |
| Flooring Contractor | Lump Sum | $18,400 |
| Bob | 8 hrs @ $45/hr | $360 |
| TOTAL | $18,760 | |
| 330 – Finishing | ||
|---|---|---|
| Type | Average Use | Total |
| Finishing Contractor | Lump Sum | $16,400 |
| Bob | 8 hrs @ $45/hr | $360 |
| TOTAL | $16,760 | |
| 410 – Landscaping | ||
|---|---|---|
| Type | Average Use | Total |
| Bobcat | 8 days @ $65/day | $520 |
| Other Supplies | Lump Sum | $2,000 |
| Bob | 20 hrs @ $45/hr | $900 |
| Mark | 60 hrs @ $35/hr | $2,100 |
| Bill | 60 hrs @ $35/hr | $2,100 |
| TOTAL | $7,620 | |
Step 5: Estimate Activity Durations
Just because a resource is necessary doesn’t mean it’s available. To determine the availability of resources, a project manager consults a document called a resource calendar. This states the availability of a resource, for example, “Mark is at jobsite X from Sep. 1 to Sep. 30.” Obviously, the new project being planned cannot use this worker at that time (unless arrangements are made with the other project manager, I suppose).
PMBOK, 5th Edition, Section 6.5, “Estimate Activity Durations”
Estimate Activity Durations is the process of estimating the number of work periods needed to complete individual activities with estimated resources. The key benefit of this process is that it provides the amount of time each activity will take to complete, which is a major input into the Develop Schedule process.
Estimating is a profession in itself, but there are three most basic methods you can utilize to determine activity durations:
- Analogous Estimating: In this method you consult the actual data on a previous or related project. Even if it has some fundamental differences, you can analyze the differences to determine the optimal number to gleen from it.
- Parametric Estimating: In this method you break down the project into major variables that have a well known and understood unit rate. For example, the square footage of a house should have a relatively well known unit rate (cost and duration per square foot).
- Three Point Estimating: When you have no real good data to go from, you can estimate the highest possible number (optimistic), and the lowest (pessimistic) as well as the most likely. Then you can use a triangular distribution (average them) or, as many statisticians would suggest, a beta distribution:
- Estimate = (Optimistic + 4 x Most Likely + Pessimistic) / 6
To build our log home, we would inspect each resource table from the previous step and determine the amount of time required. In this case I have included contingencies of between 50% and 100%, because the duration needs to include downtime. For example, there might be 3 days of plumbing but the task needs to include the time before they arrive, and I don’t believe they are likely to arrive on time.
| Task ID | Name | Durations | Cost |
|---|---|---|---|
| 110 | Excavation | 6 days | $5,850 |
| 120 | Pour Foundation | 10 days | $4,700 |
| 210 | Wood work | 20 days | $60,850 |
| 310 | Electrical & Plumbing | 10 days | $20,260 |
| 320 | Flooring | 8 days | $18,760 |
| 330 | Finishing | 12 days | $16,760 |
| 410 | Landscaping | 14 days | $7,620 |
| TOTAL | 80 days | $134,800 | |
The total of 80 days doesn’t mean much because it will still change. In step 6, we are about to prioritize the tasks and smooth the allocation of resources.
Step 6: Develop Schedule
In this step we will develop the most efficient schedule for the project. This is defined as producing the official start and end dates for each task. This can be used to direct subcontractors as to when to schedule the work, order equipment, and to prioritize internal resources. It also uses the critical path method to determine the shortest possible project completion date and which tasks directly affect it. Those tasks can then be noted into the project manager’s memory so that issues that arise within those tasks can be dealt with on a priority basis.
PMBOK, 5th Edition, Section 6.6, “Develop Schedule”
Develop Schedule is the process of analyzing activity sequences, durations, resource requirements, and schedule constraints to create the project schedule model. The key benefit of this process is that by entering schedule activities, durations, resources, resource availabilities, and logical relationships into the scheduling tool, it generates a schedule model with planned dates for completing project activities.
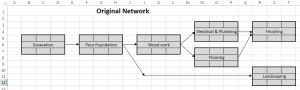
To develop the schedule, the critical path method uses a five step process:
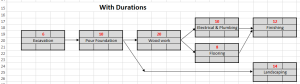
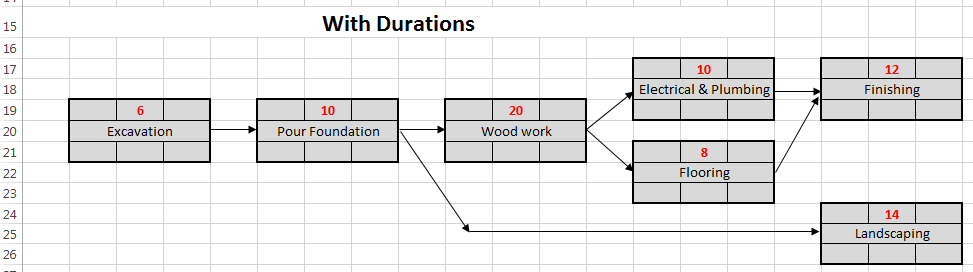
- Draw the network diagram. This can be done in MS Excel in the absence of dedicated project management software. Here is the network for the log house.
- Enter the durations of each task in the top, center box.
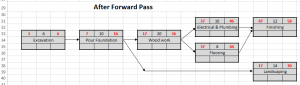
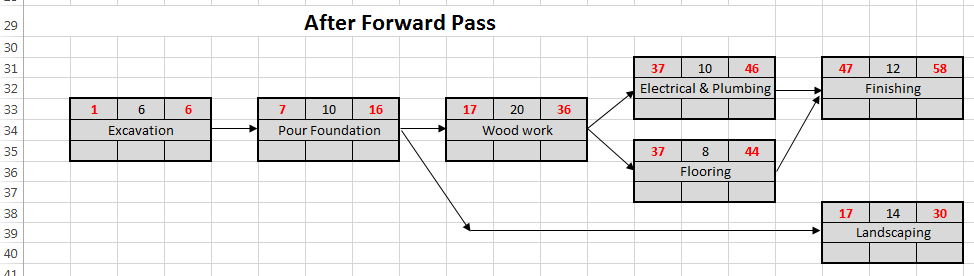
- Perform a Forward Pass, which determines the Earliest Start (ES) and latest start (LS) of each task.
- Start by entering a “1” in the top left box of the first task. This is the earliest start (ES) date.
- Determine the latest start (LS) of the first task and enter it into the top right box. LS = ES + Duration – 1. Note that the ES and LS dates are both inclusive of the task duration, therefore a one needs to be subtracted.
- Proceed to the ES of the second task. ES2 = LS1 + 1. The ES of each task is simply one day after the LS of the previous task.
- Proceed through each task by entering the ES and then the LS. When you have two LS’s to choose from, as you do with task 330, Finishing, choose the higher one.
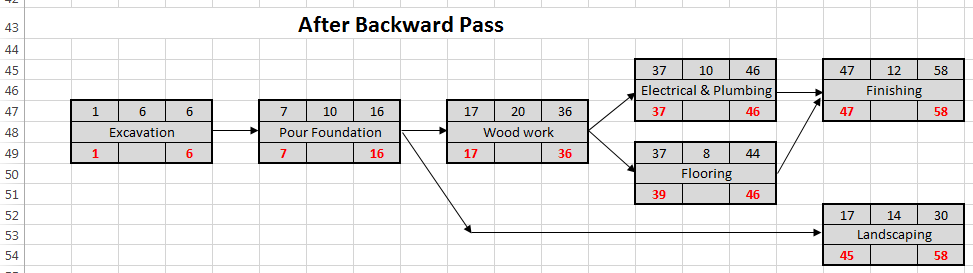
- Perform a Backward Pass, which determines the Earliest Finish (EF) and Latest Finish (LF) date of each task.
- Start by choosing the highest LS of the final tasks and enter it into the bottom right box for each final task. In this case, 330 – Finishing, and 410 – Landscaping are both final tasks. The higher LS is 58. This value goes into the LF for both.
- Determine the earliest finish (EF) and enter it into the bottom left box. EF = LF – Duration + 1.
- Proceed to the LF of the previous task. EF1 = LF2 – 1.
- Proceed through each task by entering the LF and then the EF. When you have two LF’s to choose from, as you do with task 210 – Wood work, choose the lower one.
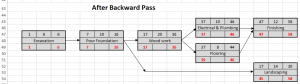
- Enter the float for each task in the bottom, center box. Float = EF – ES. This will be used in the bar chart (also called Gantt Chart) coming up next.
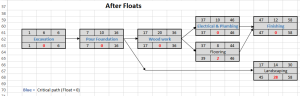


Once the forward and backward pass are completed, the ES and float of each task are known. These are the two variables which are carried forward into the final step of drawing the graphical bar chart, also known as a Gantt Chart.
Firstly, each task is drawn on it’s ES date and the resources are plotted underneath. The float of each task is usually drawn with a solid line underneath the task’s bar chart. In the below example, for the log house I have used MS Excel to draw out a simple, basic gantt chart.
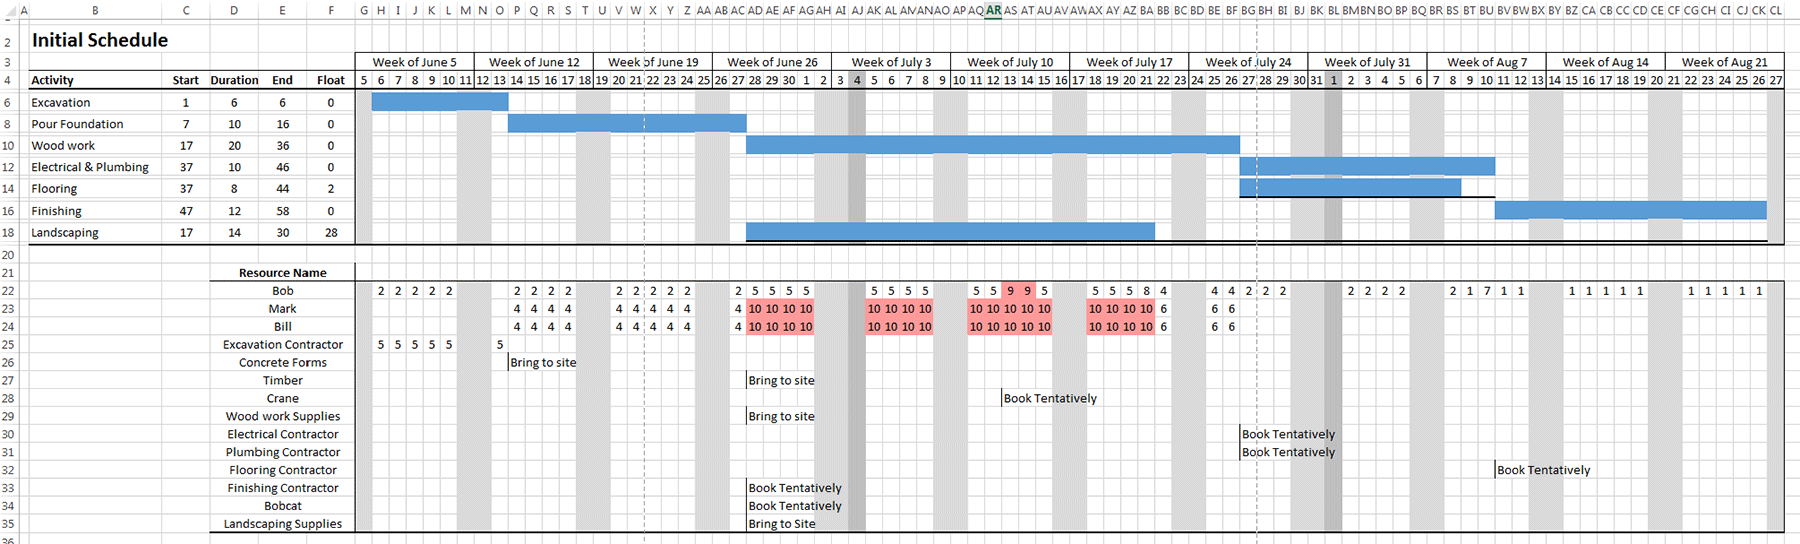
There is one last step. Do you see how the resources are not smooth? It would be a coincidence if Bob were to be working the same number of hours per day throughout the whole project, but that’s ideally what we want. That’s why we perform one last step called Resource Levelling.
In resource levelling, each task with float is moved to its ideal place within its float in order to “smooth” the overall use of project resources. Have you ever had to utilize project team members on overtime only to see them idle a day or two later? This is not efficient for the organization and projects should be planned to maximize the usage of their resources.
In the log house example above, the red highlighted boxes show days where people are working more than 8 hours per day. It is easy to see that the Landscaping task has a very big float and should not be completed at the same time as the Wood work. In fact, Bill and Mark can (and should) be doing the landscaping during Electrical & Plumbing, because they are otherwise idle (or available to another project). So we move the landscaping item to start on July 27, and then neither Bob nor Mark will be scheduled for 10 hour days.
Here is the final project schedule.
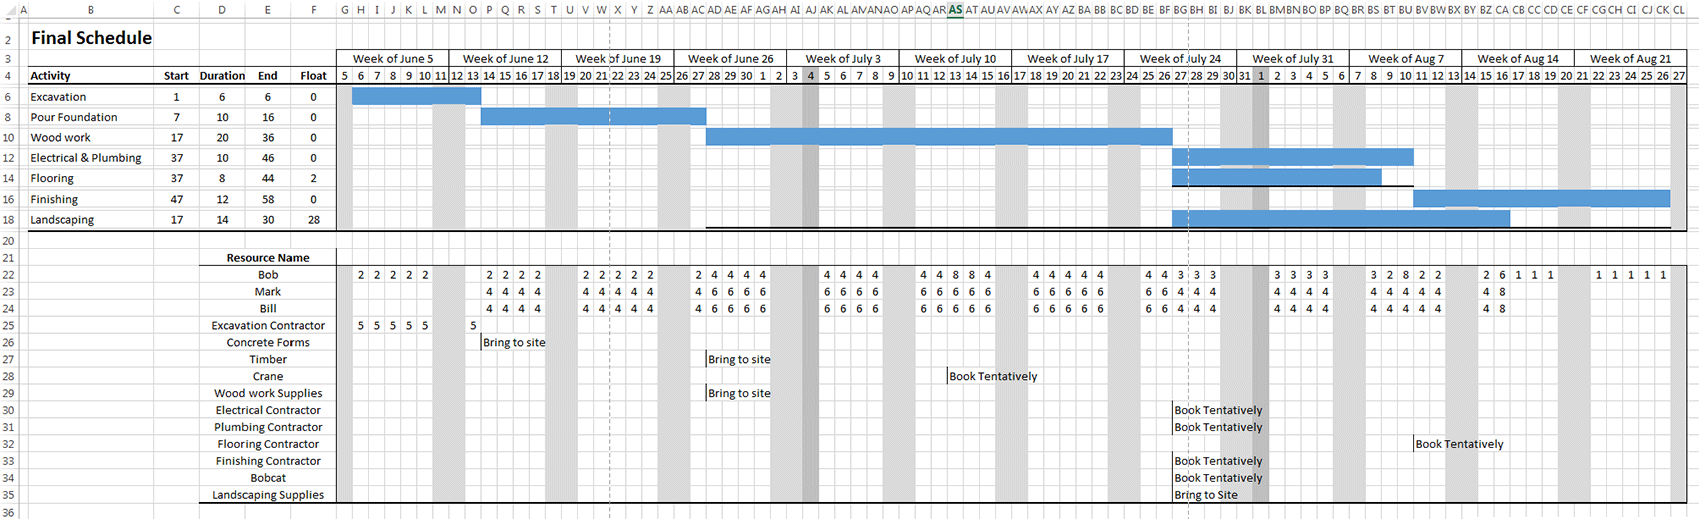
Did you notice how easy it was to see that you will need Bill and Mark, the laborers, for 9 and a half weeks, and Bob the foreman for 12 weeks this summer to build the log house? I am purposely calling a 4-6 hour day a full day (that they are not available to another project) because this allows them to call in sick, take vacation, or be needed on another project in a pinch. I like to keep 6 hours/day as a practical maximum. In some cases extra one-time hours have been assigned, such as Bob using 8 hours per day for two days while the crane is on site. But this short burst of time is realistic, and can be sustainable when the rest of the task uses only 4 hours/day of his time.
Also, it’s easy to see when things are coming up, like scheduling the plumbers and electricians, or ordering supplies. If you looked at this schedule every day throughout the project, you’d have everything under control.
Simple upgrades to this spreadsheet include adding contingencies, breaking down the supplies even further, and adding notes within the resources section like when to order supplies so that they are needed on the job site.
Conclusion
There you have it!
Do you think you could build a log house in 58 days with $134,800?
The truth is that I’ve left some things out for clarity. In real life you will probably have a few more tasks like roofing, drywalling, painting, etc., and you will need the electricians to come back to hook up the light fixtures. So don’t use my figures as gospel, they are probably on the low side. But if you are actually building a log house, or whatever your project consists of, start with this template and make sure all the tasks are there.
Good luck with your project scheduling!