Six Sigma is a hot buzzword these days, but what is it and how does it really work? In this article I will give you a quick overview and get you grounded to see if it will help you. In reality it takes a week long intensive course to get all the concepts, and requires several months of hands on experience if you want to become a green or black belt. Therefore, this is definitely a crash course.
History
Six Sigma was developed by Motorola during the 1980’s and subsequently adopted and popularized by General Electric (GE) during the 1990’s. GE’s famous CEO Jack Welch, a chemical engineer, implemented it throughout the organization. In his book “Straight from the Gut” he said that he figured that GE had saved $1 billion per year because of it.
Six Sigma Methodology
I going to have to start with some high school statistics, but before you run away screaming let me just reassure you it’s pretty intuitive, and you might even feel pretty smart once you get through this.
If you throw darts at a dart board, you might hit some bullseyes, and you might miss the board a few times, but most will be in some sort of average middle ground. Similarly, in a manufacturing process most products will be defect free but a certain (hopefully small) percentage will be defective. This natural curve shaped distribution of data is called the normal distribution. Statisticians like to define the “spread” of the distribution using a number called the “standard deviation” so you can express how many defects there are in terms of the number of “standard deviations” from the mean.
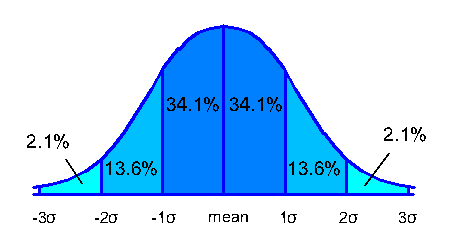 The standard deviation is called “standard” because the percentages that fall into each standard deviation (34.1%, 13.6%, and 2.1%) are always the same. Only the width of each slice is changed to match the data set you’re working with. This means that the deviation can be compared to other data sets. You don’t need to know why the percentages have been established the way they have, only that to define the “spread” of the data you can simply state the standard deviation.
You will notice that the standard deviation is represented by a greek letter sigma (σ).
In Six Sigma methodology, the intended goal of a manufacturing process is to limit product defects to six standard deviations, i.e. six “sigmas.” If you’ve been paying attention, you’re probably thinking “whoa, that’s a very small number!” In fact, that level of defects represents:
- 0.0000002% defective.
- one defect in 500 million products
If your company is not there yet, then maybe Six Sigma is worth trying!
The Upper Specification Limit (USL) is six standard deviations above the mean, and the Lower Specification Limit (LSL) is six standard deviations below the mean.
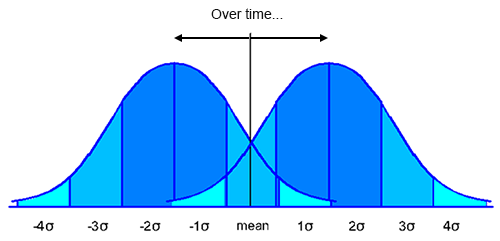
The 1.5 Sigma Shift
But there’s more. Because there are variations in manufacturing processes over time, you can’t be completely certain that the mean will always stay constant. For example, a manufacturer of vehicle doors might use Six Sigma methodology to set the upper and lower specification limits for paint color, only to realize in several years time that the mean paint color has changed due to creep in the manufacturing processes. Of course, if the slow change of the paint color is not acceptable, other systems need to be initiated, but a small variation can and should be taken into account up front. Six Sigma accounts for the long term variation of the mean by using a one and a half sigma “shift.”
This means that the distribution used to set the specification limits in Six Sigma is not the actual mean, but the mean plus or minus 1.5 standard deviations.
To ensure that the final result is within the specification limits, the goal is not actually 6 standard deviations, but 4.5.
Here’s a bit of lingo. A manufacturing process is described with a certain sigma level. For example, if you are producing 5% defective units, you have a “sigma level of 2.” (two standard deviations from the mean).
To achieve the enormously good level of product quality that Six Sigma requires, there are two processes which are used.
- Improve Existing Processes: Define-Measure-Analyze-Improve-Control (DMAIC) is pronounced “Demayik”
- Design New Processes: Define-Measure-Analyze-Design-Verify (DMADV) is pronounced “Demadvee”
Improving Existing Processes with DMAIC
When you are looking to improve an existing process:
- Define the problem and the metrics which are most important to measure success. Define the Critical-to-Quality (CTQ) issues.
- Measure the current process and document the baseline performance.
- Analyze the top causes of the defect. Many techniques can be used in this phase including Pareto Charts, Fishbone Diagrams, and Regression Analysis.
- Improve the process by testing various alternatives and implementing an action plan.
- Control. Implement controls to ensure that the defect does not re-occur over time.
Designing New Processes with DMADV
When designing a new process, the first three steps are the same.
- Define. See DMAIC.
- Measure. See DMAIC.
- Analyze. See DMAIC.
- Design the process which will produce the desired result.
- Verify that the process will produce the desired result.
Although the first few steps are the same, my experience is that their execution feels slightly different when a process is not already in place.
Six Sigma Tools
To carry out the above steps, Six Sigma practitioners use the following tools:
- Pareto Charts
- Design of Experiments (DOE)
- Analysis of Variance (ANOVA)
- Regression Analysis
- Failure Mode and Effects Analysis (PFMEA)
- Fishbone Diagrams
- Time Series Plots
- Hypothesis Testing
- Histograms
Applicability of Six Sigma
Six Sigma was developed for manufacturing processes, but it’s methods can be widely applied across other industries with some modifications. For example, an engineering consulting firm could measure the Cost of Quality by measuring the number of hours spent on review changes, or tabulate the number of reports that fell below certain quality parameters (pareto charts and histograms). A software development firm could use DMAIC to prioritize product upgrades and reduce customer service costs.
The concept of Six Sigma applies in any industry, even if you are not producing millions of widgets. You may not be measuring defects in minute percentages, per thousands or millions of units. But a Six Sigma green or black belt can produce quality improvements in any industry, even if the ground level concept of six standard deviations has less meaning in that environment.