Since many people become project managers via promotion from a technical role, “flying by the seat of your pants” is often the norm. You might know the progress and delivery date of various tasks, the deadline date for the overall project, and you might be on top of the overall project progress. But today I will show you the right way to monitor project progress to ensure your completion dates are met.
You will be surprised how easy it is to ensure completion dates and budgets are met. Today I will explain the correct way to track projects using project management fundamentals, and at the end I will work through an example and explain my experiences to show you how to make the method sing.
There is going to be alot of stuff thrown at you today, but rest assured the daily tasks at the end are still fairly simple and have been broken down into small steps that are thoroughly explained. Trust me, it will be worth it.
Task Definition
Before I continue I must add that you need a baseline. Two days ago we created a task list for your project. Yesterday I talked about schedules and how they need to be set in stone and changes rigorously documented. Each task in the schedule requires the following two things in order to “define” the project, thereby creating a baseline to track project progress against:
- Start and end dates
- Budget
With those two things established, project variances can be calculated.
Determining Project Progress
To properly track a project, you need to calculate two things on a regular basis (I suggest weekly):
- Cost Variance: Your project is over budget
- Schedule Variance: Your project is behind schedule
Notice I didn’t say “under budget” or “ahead of schedule.” Does that ever happen?
If you use project management software you will probably have these calculated automatically, but the calculation requires an estimate of percent complete for each task. Obviously your software will not be able to guess that, and you will have to input it.
Let’s define a few variables:
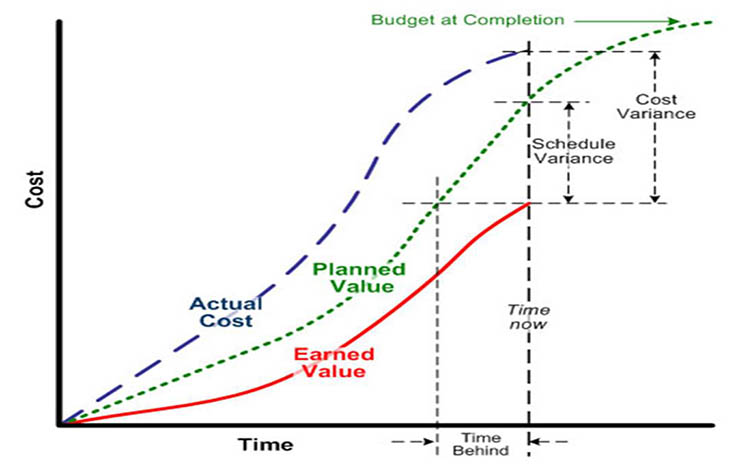
- Planned Value (PV): The anticipated (scheduled) completion of the task. For example, if the start and end dates of the tasks are March 1 and March 10, and it’s March 3, you’ve scheduled for 30% completion. The PV is 30% of the task budget. Planned Value is sometimes called Budgeted Cost of Work Scheduled (BCWS).
- Earned Value (EV): The actual completion of the task. For example, if you have completed 7 out of 10 fence post holes, you are 70% complete and the EV is 70% of the task budget.
- Actual Cost (AC): The actual cost of the task so far. This includes time, materials, etc. Also known as Actual Cost of Work Performed (ACWP).
Each one of these values is expressed as a cost (i.e. units are dollars, euros, etc.). PV and EV are determined as a percentage of the task budget, and AC is already in monetary form.
Calculation of Project Variances
At this point it’s easy. To calculate the variances, you need only do some elementary school math:
- Cost Variance: CV = EV – AC.
- Schedule Variance: SV = EV – PV.
Performance Indicators
If you prefer percentages (of overall project completion), you can state the cost and schedule variance in percentages with performance indicators,
- Cost Performance Indicator: CPI = EV/AC.
- Schedule Performance Indicator: SPI = EV/PV.
What do they mean?
 A positive variance means you are ahead of schedule or budget, and it is good. A negative variance is bad.
The size of the variance tells you alot. For example, if your project’s total budget is $100,000 and your schedule variance is -$20,000, you need to make some arrangements to complete the project on time. Similarly for the cost variance, the size of the variance compared to the project budget tells you the scale of the disaster.
Also, it’s not just the size but the trend. I’ve seen some projects where the project manager shows small variances, but each week they get a little bigger. It is a telling sign that something needs to be done before the problems begin to arise.
Example
To conclude, I will present a full example. Let’s say you are the project manager for the renovation of 3 hotel rooms. The tasks are as follows:
- Preparation. Jan. 1-Jan. 10, $5,000
- Room #1: Jan. 10-20, $15,000
- Room #2: Jan. 15-25, $15,000
- Room #3: Jan. 20-30, $15,000
- Wrap-up: Jan. 25-31, $5,000
It’s Jan. 16 today and you want to know how far behind/ahead of schedule and over/under budget you are. You figure you’re 20% complete Room #1 and 10% on Room #2, and you’ve spent $5,500 on preparation and $3,500 on Room #1.
| Task | PV | AC | EV | Schedule Variance | Cost Variance |
|---|---|---|---|---|---|
| Preparation | $5,000 | $5,500 | $5,000 | $0 | -$500 |
| Room #1 | $6,000 | $3,500 | $3,000 | -$3,000 | -$500 |
| Room #2 | $1,500 | $0 | $1,500 | $0 | $0 |
| Room #3 | $0 | $0 | $0 | $0 | $0 |
| Wrap-up | $0 | $0 | $0 | $0 | $0 |
| TOTAL | -$3,000 | -$500 | |||
Since the variances are both negative, the project is behind schedule and over budget.
The cost variance is minor, and maybe you can find $500 somewhere between now and the end of the project.
But the schedule variance is about 6% and finishing on time is beginning to be a concern. It’s all due to room #1, so it might be a good idea to secure some resources so the completion of room #1 doesn’t hold up the others.
How to Make Sure you Finish on Time and Under Budget
Firstly, the variances give you early warning of schedule and cost problems and let you take action long before you otherwise would.
My experience is that when project team members are familiar with the variances they will take the effort to correct them. I give all my project teams a weekly cost and schedule variance during my progress meetings, and when they know a project is behind, even a small amount, they tend to give it an extra bit of effort that week. If I did not do this, they (and you) wouldn’t really know it was behind until it was far enough behind that it required action.
Of course, if the variance is negative for several weeks, trending lower, or extremely negative, there is something wrong that needs to be addressed. I have found especially when variances are trending lower it sometimes isn’t immediately obvious until you do the calculation. For example, you might see -$1,000 in the first week, then, -$2,000, then $-3,000. Small numbers, but it’s only because you calculated the variances that it becomes obvious that things need to be sped up or you will have an issue.
Today’s Task
Today’s tasks are a bit more involved, but this step should still only take 5 minutes. If you’re using a project that has already been completed, you will need to pick a random percent complete for each task, but I encourage you to go through the exercise anyway so you have a good knowledge of how to calculate project status in the future.
- Determine the required percent complete of each task based on today’s date. For example, if the task goes from Feb. 1 – Feb. 10, and it’s Feb. 7, it is supposed to be 70% complete. Multiply by the task budget to express it in monetary terms, and total them up. This total is called Planned Value (PV).
- Find out what the actual cost of the task was so far. This is called Actual Cost (AC).
- Estimate the percent complete of each task. Multiply by the task budget to express it in monetary terms, and total them up. This is called Earned Value (EV).
- Calculate the Schedule Variance: SV = EV – PV. Sum the total.
- Calculate the Cost Variance: CV = EV – AC. Sum the total.
The following is my guarantee to you: If you calculate the schedule variance and cost variance weekly, you will have the earliest possible warning of the project going south. And that early warning is pure gold, my friends. When the problem is still small, it just takes a short conversation, email, or whatever, to keep the project on track.
Navigation
- Forward to Day 8
- Back to Day 6
- Overview